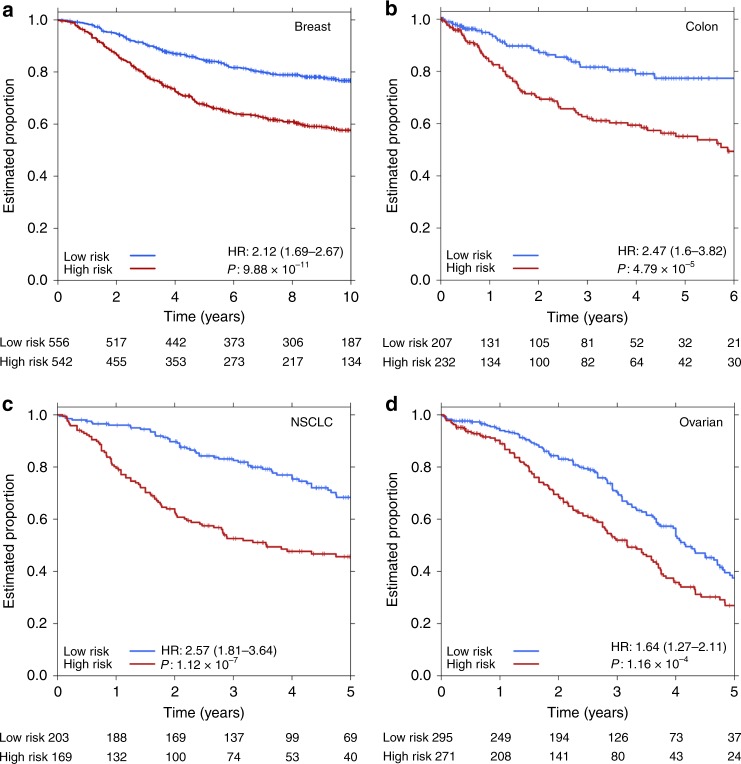
Fig. 3.
Multi-subnetwork biomarkers for multiple cancer types. a–d Kaplan–Meier survival plots using Model N over the entire validation cohort with subnetwork selection performed through Cox model using generalized linear models (L1-regularization) on the training cohort. Final model resulted in 23/50, 5/75, 23/25, and 23/50 subnetworks for breast, colon, NSCLC and ovarian cancers, respectively (Supplementary Tables 10–13). P values were estimated using Wald-test

