Fig. 4.
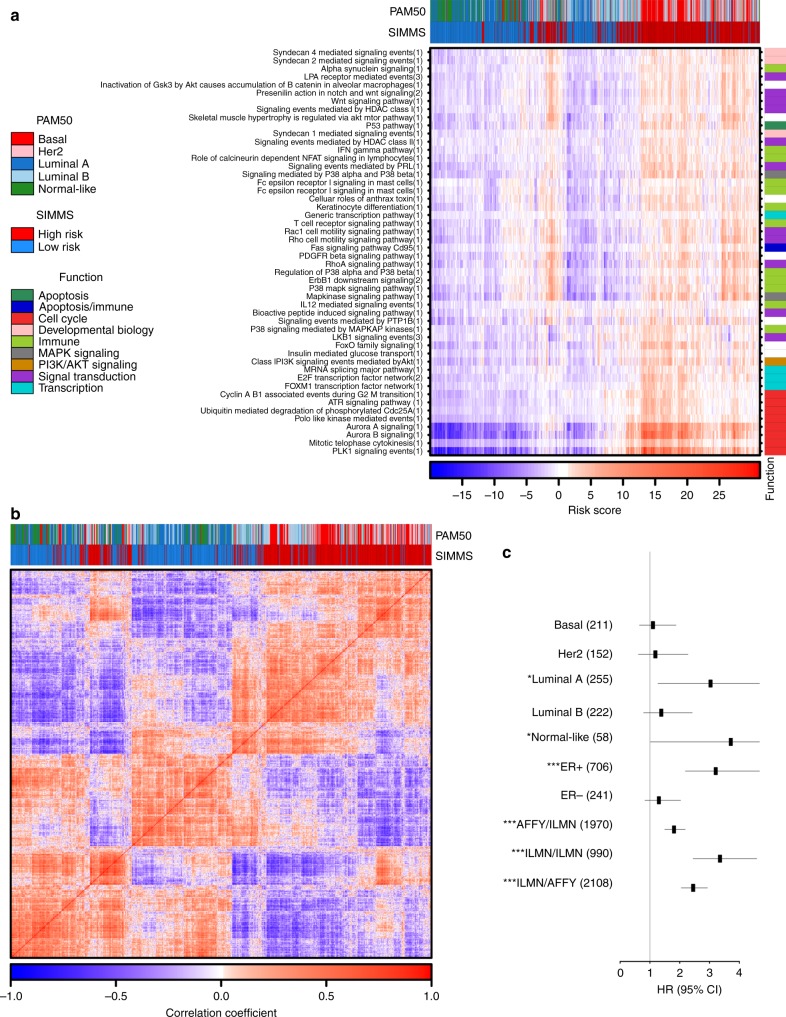
Clinical association of breast cancer biomarkers. a Heatmap of patients’ risk scores estimated using top nBreast=50 subnetworks in the Metabric validation cohort. Column covariates show patient classifications based on PAM50-based molecular subtypes and SIMMS predicted risk groups. Row covariates indicate functional class of subnetwork’s originating pathway. Columns and rows were clustered using divisive clustering. Number in parenthesis of y-axis labels represents subnetwork number from a given pathway; with details in subnetwork database (SIMMS R package). ‘Fc Epsilon Receptor I Signaling in Mast Cells’ is repeated twice because it is represented by two different pathways in the database (ID = 100165 and ID = 200003 in subnetworks database; SIMMS R package). b Clustered (divisive) heatmap of correlation (Spearman) between patients using their subnetwork risk score profiles (top nBreast=50 subnetworks) in the Metabric validation cohort with covariates as detailed in a. c Forest plot showing HR and 95% CI (multivariate Cox proportional hazards model) of the breast cancer subtype-specific markers, as well as cross-platform validation. Datasets originating from Illumina (ILMN) and Affymetrix (AFFY) were used in turn for cross platform training and validation. Due to limited availability of clinical annotations on Affymetrix based cohorts, only the Illumina dataset (Metabric) was used for subtype-specific models. For these, the Metabric-published training and validation cohorts were maintained for training and validation purposes. Numbers in parenthesis indicate the size of the validation cohort. Asterisks represent statistical significance of differential outcome between the predicted low-risk and high-risk groups (*P < 0.05, **P < 0.01, ***P < 0.001, Wald-test)

