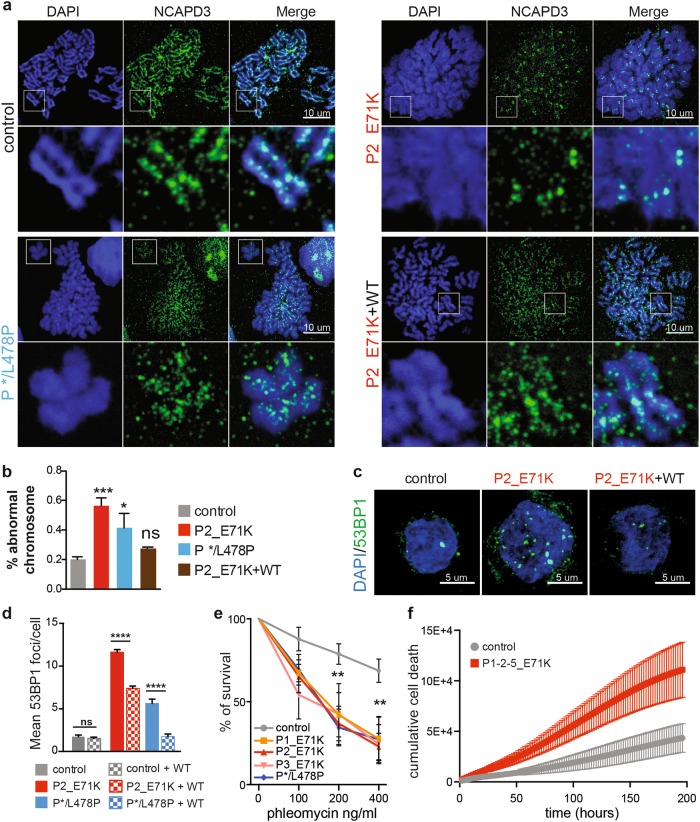
Fig. 6. TTC7A deficiency affects genome integrity and survival.
a Chromosome spreading of B lymphoblastoid cell lines (B-LCLs) blocked in metaphase using nocodazole. DNA is stained with DAPI and chromosome axis is delineated with NCAPD3 (a subunit of condensing II complex). Insets are depicted below each sample. Patient’s E71K B-LCLs re-expressing Flag-tagged WT_TTC7A is shown on the below right panel, scale bar: 10 µm. b Quantification of chromosomes with abnormal structure. c Assessment of 53BP1 foci formation in control and patient B lymphoblastoid cell lines (B-LCLs) non transduced or transduced with Flag-tagged WT_TTC7A. Left: Immunostaining of 53BP1 imaged by confocal microscopy, scale bar: 5 µm. d Quantification of 53BP1 foci number. Mean of three independent experiments ± SEM. Total number of cells in control = 392; control + WT = 359; P2_E71K = 259; P2_E71K + WT = 241; P */L478 = 95; P */L478 + WT = 108; Tukey’s multiple comparisons test multiples ****p-value < 0.0001. Mean of four independent experiments ± SEM. Dunnett’s multiple comparisons test; ***p-value < 0.001; *p-value < 0.05. e Phleomycin sensitivity test. An increased dose of phleomycin was applied on B-LCLs, and survival was assessed 7 days later. Mean percentage ± SEM; linear mixed-effects model fit by REML, p < 0.001. f Cumulative cell death upon CD4+ T-cell activation. Isolated naïve CD4+ T cells were activated with CD3/CD28. Cell growth and death was monitored using an IncuCyte ZOOM live cell imager (Essen Bioscience), starting at 24 h after activation and every 2 h during 9 days. Growth was measured by confluence phase-mask, and cytotoxicity by using Cytotox red fluorescence reagent. Two controls and three patients were analyzed; values are mean ± SEM. Tested using linear mixed-effects regression model, ANOVA, P < 0.0001418

