Fig. 3.
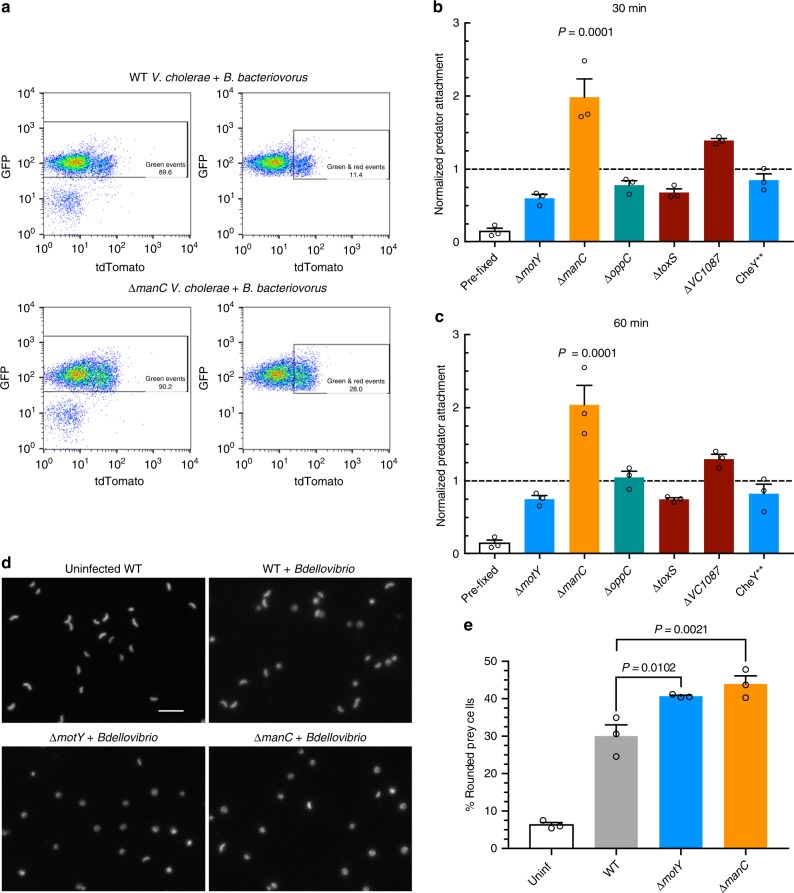
V. cholerae rounding and attachment by B. bacteriovorus. a Gating strategy for analyzing B. bacteriovorus attachment to V. cholerae by flow cytometry. The left plots show all events, while right plots show green-only and double-positive events for the same experiment. b, c Predator attachment to prey by flow cytometry at MOI 1 at 30 min (b) or 60 min (c) post infection. As a control, fluorescent B. bacteriovorus and V. cholerae were fixed immediately upon mixing to account for false positive interactions. All attachment to mutant prey was normalized to WT prey attachment for three biological replicates. d Fluorescence images of GFP-expressing V. cholerae 1 h following infection with B. bacteriovorus at MOI 1. The scale bar indicates 10 µm. e The percentage of rounded V. cholerae cells was calculated by analyzing images by Matlab for roundness (eccentricity) of three biological replicates. Error bars represent standard error of the mean. Statistics were analyzed by ANOVA with Dunnett’s multiple comparison’s test

