Fig. 2.
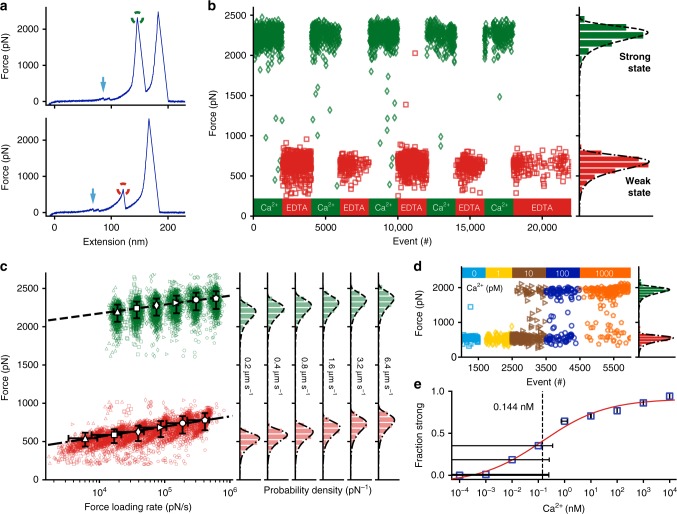
B domain stability and unfolding force are governed by calcium. a SdrG B1 unfolds in 10 mM Ca2+ at over 2 nN (strong state, green circle) and here at ~ 650 pN in the presence of 10 mM EDTA (weak state, red circle) at a retraction velocity of 1.6 µm s−1, after ddFLN4 fingerprint unfolding (cyan arrows). b SdrG B1 domain stabilities can be cycled repeatedly by alternate application of Ca2+ 10 mM (green diamonds) and EDTA 10 mM (red squares). c Dynamic force spectrum of the weak and strong state stabilities. Strong state (green) in 10 mM Ca2+: 0.2 µm s−1 (triangles, N = 848), 0.4 µm s−1 (squares, N = 1128), 0.8 µm s−1 (diamonds, N = 1162), 1.6 µm s−1 (forward triangles, N = 1202), 3.2 µm s−1 (circles, N = 1039), 6.4 µm s−1 (pentagons, N = 1129), BE fit (dashed line, ∆x = 0.083 nm, koff0 = 2.8E–17 s−1). Weak state (red) in 10 mM EDTA (markers as before): 0.2 µm s−1 (N = 664), 0.4 µm s−1 (N = 767), 0.8 µm s−1 (N = 953), 1.6 µm s−1 (N = 922), 3.2 µm s−1 (N = 861), 6.4 µm s−1 (N = 1007), BE fit (dashed-dotted line, ∆x = 0.071 nm, koff0 = 0.011 s−1). d Ca2+ titration experiment with SdrG B1 immobilized on a surface in varying Ca2+ concentrations, starting from EDTA 10 mM to Ca2+-free buffer in which all B1 unfolding events show the weak state. At 10 pM Ca2+ the strong state starts to appear constituting the majority of unfolding events at 1000 pM Ca2+. There are almost no unfolding events in an intermediate regime (N = 995). e Affinity estimate of SdrG B1 from combined Ca2+ titration experiments, showing the fraction of all curves with B domain unfolding events in the strong state. A four-parameter logistic regression fit (red line) yields an inflection point of 0.144 nM, pointing to a sub-nM KD of SdrG B1 for Ca2+ in the weak state, albeit concentration uncertainties (error bars as trace Ca2+ uncertainty in buffer and 1% dilution error, N = 1703) in the sub-nM range are very high

