
Figure 6.
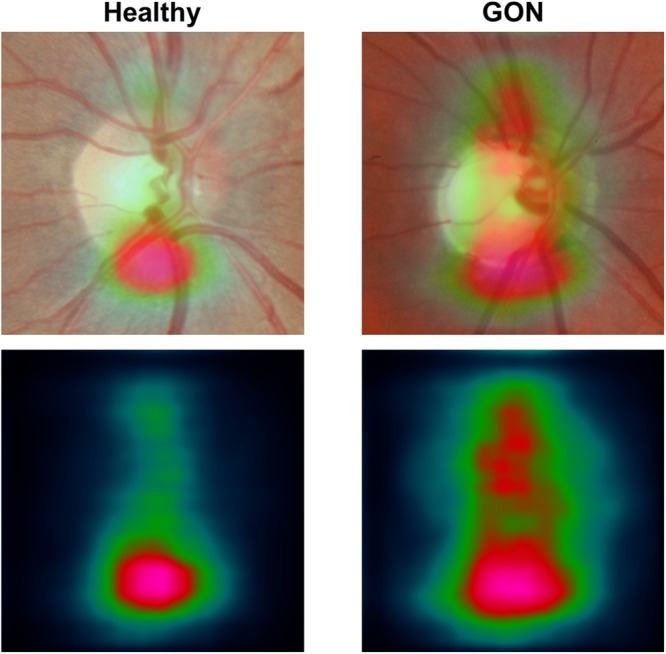
Mean occlusion testing maps showing most significant regions for distinguishing healthy and glaucomatous optic neuropathy (GON) images. In these images, bright pink regions indicate a large impact on model predictions while dark blue regions indicate a very limited impact on predictions. The maps were generated by averaging occlusion testing maps of the healthy and GON testing images in right eye orientation. The heat maps (bottom) are shown overlaid on a representative healthy and GON eye (top).