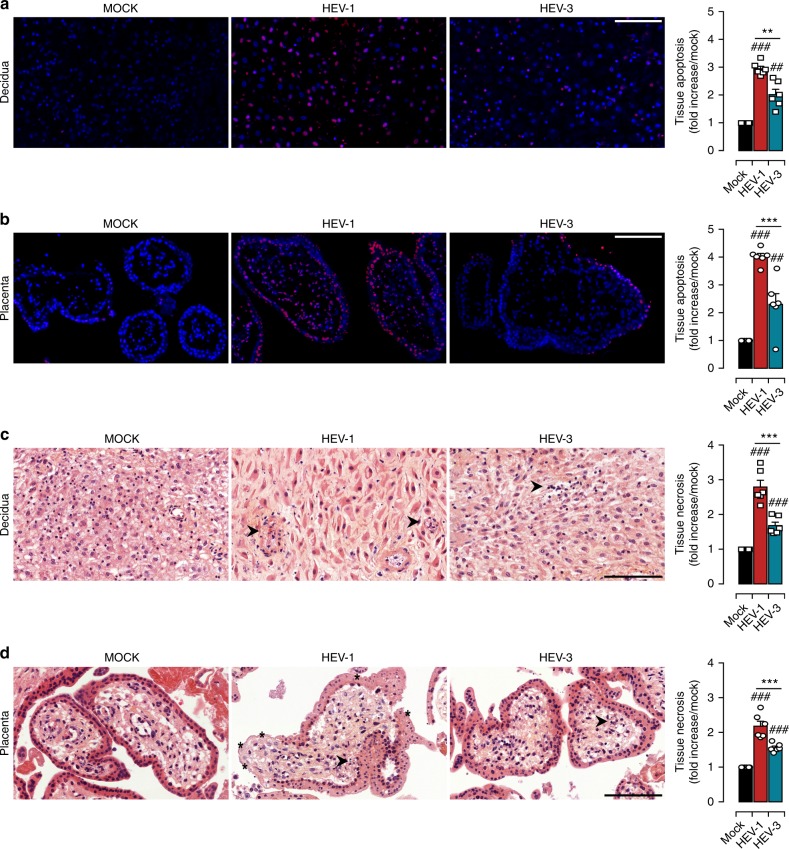
Fig. 2.
HEV-1 causes severe injury in decidual and placental tissues. Histological analyses of apoptosis (TUNEL staining, a, b) and necrosis (H&E staining, c, d) in explants sections prepared from mock, HEV-1, or HEV-3 infected tissues, 5 days post infection. a, b Representative large field of view of TUNEL stained sections prepared from the decidua a and placenta b. Staining indicates the apoptotic cells (red) and nuclei (blue). Scale bar, 100 µm. Bar graph illustrates the increase of tissue apoptosis in HEV-1 (red) or HEV-3 (cyan) infected tissue explants, compared to levels detected in mock-infected tissue explants (black) and represented as fold increase. c, d Representative large field of view of H&E stained sections prepared from the decidua c and placenta d. Arrowheads point to necrotic zones with nuclear changes illustrated by pyknosis, karyorrhexis, and karyolysis. Stars indicate an injured syncytiotrophoblast layer. Scale bar, 100 µm. Bar graph illustrates the increase of tissue necrosis in HEV-1 (red) or HEV-3 (cyan) infected tissue explants, compared to levels detected in mock-infected tissue explants (black) and represented as fold increase. Data represent mean values ± S.E.M. of six independent donors. * denotes a statistical comparison between HEV-1 and HEV-3 infected tissues and # represents a statistical comparison between mock and HEV-1 or HEV-3 infected tissues. **/##P < 0.01; ***/###P < 0.001 by repeated measures ANOVA with Tukey post hoc test

