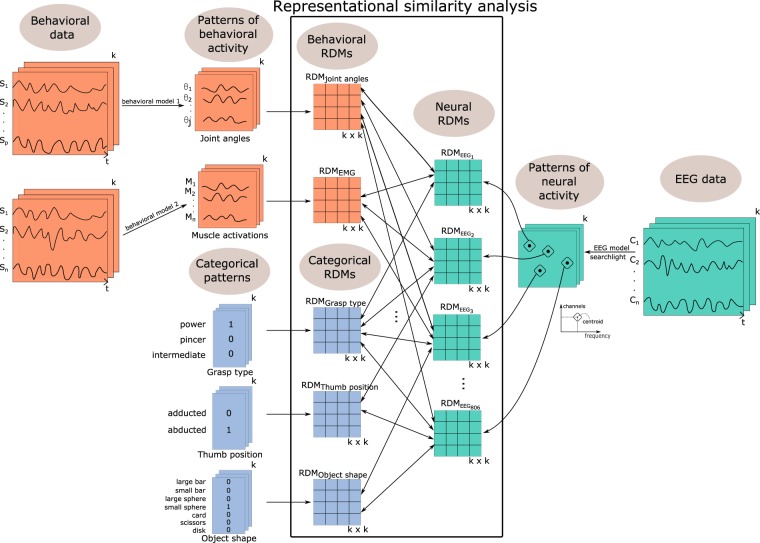
Figure 2.
Representational similarity analysis (RSA) pipeline, including EEG searchlight analysis, computation of behavioral patterns, representation of categorical patterns and RDM computation for the three different modalities: EEG data (in green), behavioral data (in orange) and categorical models (in blue). As notations, we used t to indicate time, k for the 33 conditions, s1..sn(p) indicate the sensors used to record behavioral data (n = 8 for muscle activity and p = 5 for the PCs of kinematic activity), C1..Cm the 64 channels for neural data recording, M1..Mn denote the muscle activations, while θ1..θj indicate the kinematic synergies derived from joint angles.

