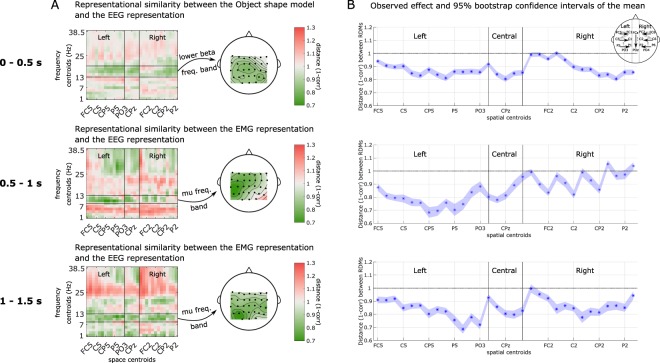
Figure 3.
(A) Representational similarity analysis between the candidate representations and the reference representations extracted through a searchlight implementation. The vertical black lines mark the area covered by the midline centroids. The horizontal lines mark the frequency band written on the arrows. The space centroids are sorted from periphery-to-midline and anterior-to-posterior. Topographical representation of the similarity in the specified frequency bands. On the first row, the dissimilarity w.r.t. the categorical Object shape model in the time window between 0–0.5 s. The second and third rows show the dissimilarity w.r.t. the EMG representation in the time window 0.5–1 s and 1–1.5 s. (B) Bootstrapping results of the RSA for the three time windows. The contralateral and central brain regions show smaller distances (higher correlations) between the reference (EEG) representation and the candidate (categorical Object shape and behavioral EMG) representations in the centro-parietal and parietal regions. The shaded area indicates the 95% confidence interval computed after 500 bootstrapping iterations.

