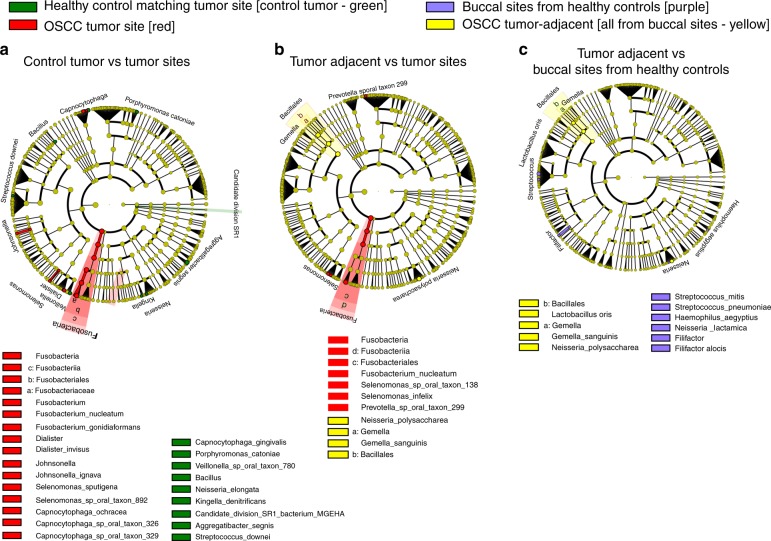
Fig. 1.
Statistical differences in the phylogenetic composition of active communities according to LEfSe. Cladograms report the taxa showing different abundance values for the transcripts (according to LEfSe). Metatranscriptome hit counts were obtained using Kraken against an oral microbiome database. Counts were then analysed using LEfSe to identify significant differences at the species level between the microbial communities compared. The alpha values were 0.05 for the Kruskal-Wallis (KW) sum-rank test and 0.01 for the Wilcoxon test. Only taxa with an LDA > 2 are represented in the cladograms. a Comparison of healthy control tumour-matched sites vs OSCC tumour sites. b Comparison of OSCC tumour-adjacent sites vs OSCC tumour sites. c Comparison of OSCC tumour-adjacent sites vs buccal sites from healthy control patients

