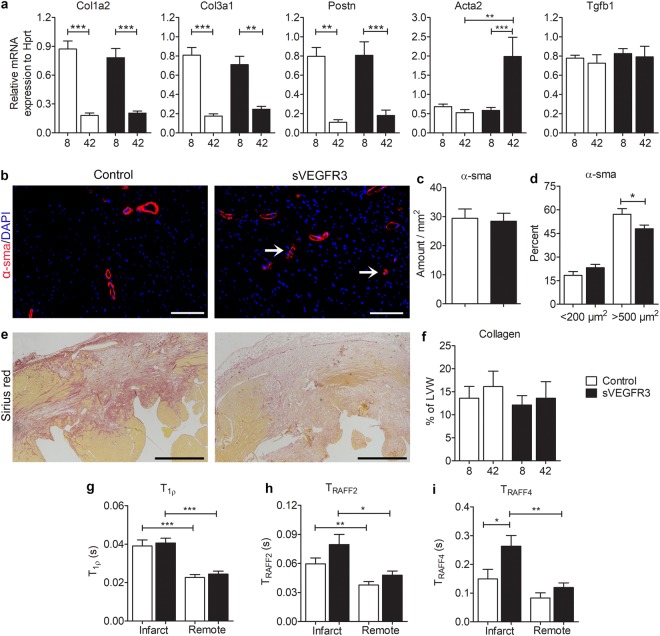
Figure 7.
Histology and novel MRI methods display differential fibrosis in sVEGFR3 mice when compared to the controls. (a) RT-qPCR analyses for Col1a2, Col3a1, Postn, Acta2 and Tgfb1 mRNAs 8 and 42 days post-MI (n = 14–18/group and n = 4–9/group, respectively). (b) Representative images of α-sma staining in heart cross-sections 42 days post-MI in sVEGFR3 and control mice. Arrows point at individual α-sma positive cells. (c) Amount of α-sma positive area in the healthy LVW in sVEGFR3 and control mice (n = 6–9/group). (d) Proportion of small (<200 µm) and large (>500 µm) α-sma positive structures in the healthy LVW (n = 6–9/group). (e) Representative images of Sirius Red staining in heart cross-sections 8 days post-MI in sVEGFR3 and control mice. (f) Quantification of collagen in LVW from Sirius Red stainings 8 and 42 days post-MI (n = 17–18/group and n = 6–9/group, respevctively). (g,i) MRI T1ρ (g), TRAFF2 (h) and TRAFF4 (i) relaxation times 7 days post-MI in infarcted and remote regions (n = 5–11/group). Scale bar in (e) is 100 µm and in (h) 500 µm. Values represent mean ± SEM. Statistical analyses were performed using two-way ANOVA with Bonferroni’s post-hoc test or Student’s t-test. *P < 0.05, **P < 0.01, ***P < 0.001.

