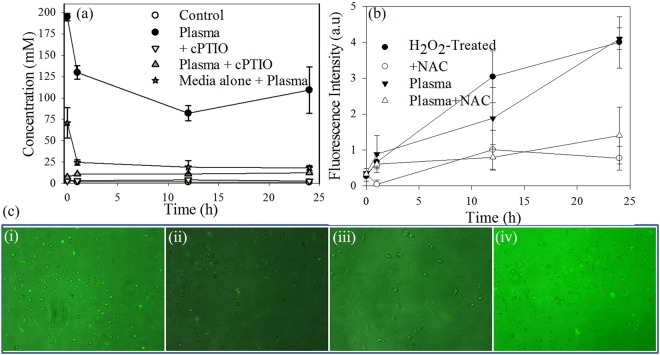
Figure 5.
(a) Analysis of plasma induced nitrite concentration as a indicator for NO generation, with and without NO scavenger cPTIO; (b)Analysis of plasma induced intracellular ROS (Oxidative stress response) as a indicator for ROS generation, with and without ROS scavenger NAC (5 mM); (c) Fluorescent micrographs of HUVECs representing oxidative stress response to plasma with and without ROS scavenger NAC (5 mM). (a) Plasma treated HUVECs; (b) Plasma treated HUVECs with NAC (5 mM); (c) Positive control (200 µM H2O2); (d) untreated control with NAC (5 mM).

