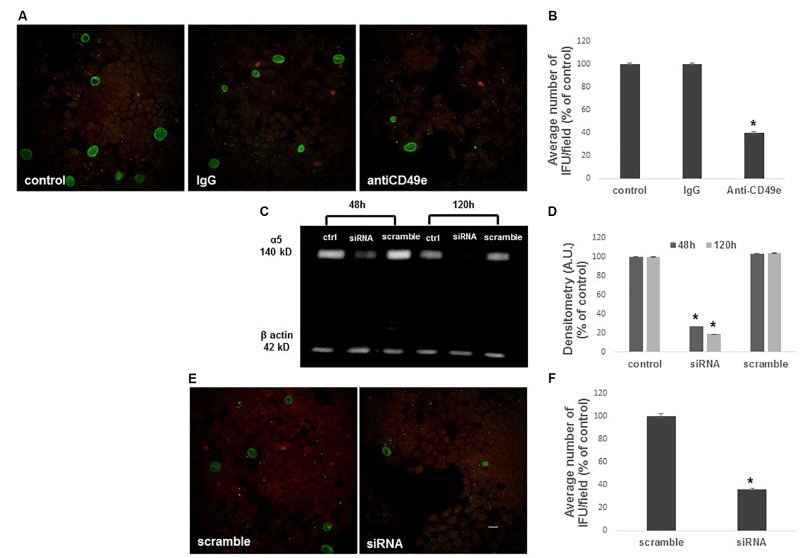
FIGURE 4.
Inhibition of C. trachomatis infection by α5 integrin subunit blocking or ITGA5 gene silencing. HeLa cells were treated or not with an anti-CD49e antibody or control IgG for 1 h, then infected with CT EBs for 48 h. (A,B) Specimens were stained for chlamydial membrane lipopolysaccharide antigen. Representative micrographs are shown. C. trachomatis infectivity was evaluated as number of IFUs/microscopic field. Results were expressed in percentage compared with control, taken as 100%. Bars represent median values, error bars represent median absolute deviations. Statistical significance was calculated vs. control. ∗P ≤ 0.01. (C,D) Western blotting of α5 integrin subunit expression in control, ITGA5 siRNA and scramble Hela cells, evaluated at 48 and 120 h post-siRNA. Quantification of α5 integrin subunit was normalized on β-actin. Bars represent mean values based on three independent experiments, error bars represent standard deviations. (E,F) HeLa cells treated with siRNA or scramble were infected with CT EBs for 48 h, and then stained for chlamydial membrane lipopolysaccharide antigen. Bar: 20 μm. Results were expressed in percentage compared with scramble, taken as 100%. Bars represent median values, error bars represent median absolute deviations. Statistical significance was calculated vs. control. ∗P ≤ 0.01.

