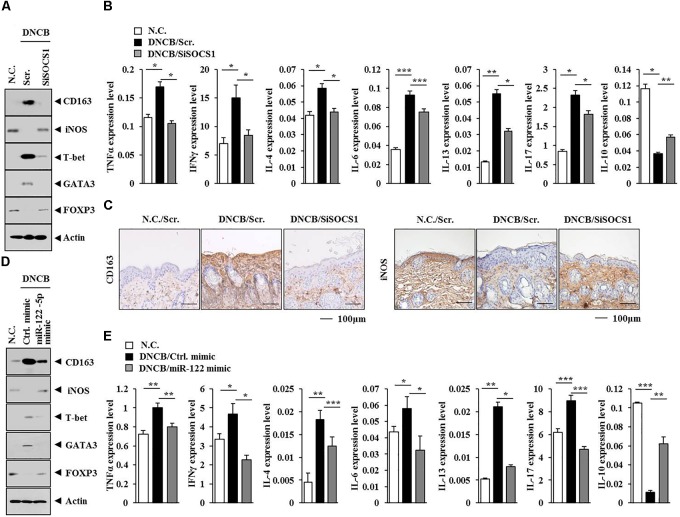
FIGURE 13.
miR-122a-5p-SOCS1 negative feedback loop regulates TH1/TH2 and regulatory T (Treg) response during AD. (A,D) Tissue lysates from the mice of each experimental group were subjected to western blot analysis. (C) Skin tissues of BALB/c mice of each experimental group were subjected to immunohistochemical staining. Scale bar represents 100 μm. (B,E) Tissue lysates from the mice of each experimental group were subjected to qRT-PCR analysis.∗p < 0.05; ∗∗p < 0.005; ∗∗∗p < 0.0005.

