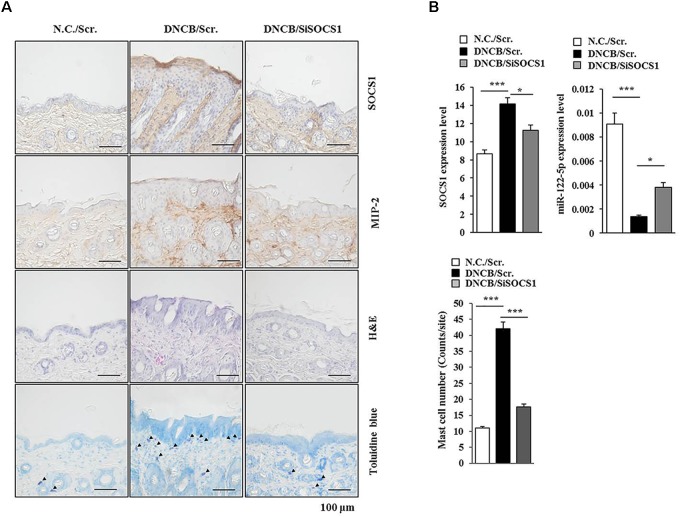
FIGURE 7.
SOCS1 regulates the expression of miR-122a-5p and MIP-2. (A) Immunohistochemical staining by employing the indicated antibody was performed. Scale bar represents 10 μm. Skin tissues of BALB/c mice of each experimental group were isolated at the time of sacrifice and were also subjected to H&E staining. Toluidine blue staining was performed to determine the number of degranulated mast cells. Closed triangle represents degranulated mast cells. (B) Tissue lysates from mouse of each experimental group were subjected to qRT-PCR analysis. ∗p < 0.05; ∗∗∗p < 0.0005. The number of degranulated mast cells was also determined. Closed triangle represents degranulated mast cells. Scale bars represent 100 μm.

