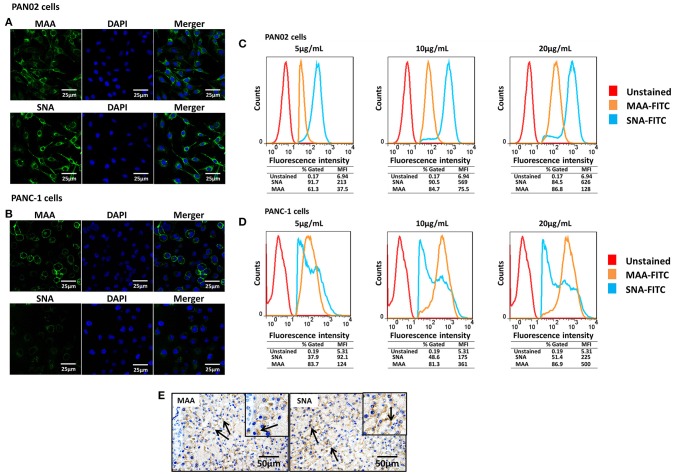
Figure 1.
Pancreatic cells express α-2,3- and α-2,6-linked sialic acid (SA) receptors. (A,B) The pancreatic cell lines PAN02 and PANC-1 were placed on polylysine-coated slides and stained with fluorescein isothiocyanate (FITC)-conjugated Sambucus nigra bark lectin (SNA) or Maackia amurensis lectin I (MAA-I) (green), and 4′,6′-diamidine-2-phenylindole (DAPI; blue) for nuclei. (C,D) Trypsinized PAN02 and PANC-1 cells were incubated with FITC-conjugated SNA or MAA-I (concentrations from left to right are 5, 10, and 20 μg/mL) and analyzed using flow cytometry to determine the relative percentages of cells expressing α-2,3-SA (MAA, yellow) or α-2,6-SA (SNA, blue) compared to unstained cells (red). (E) Representative pancreas sections from mock-treated mice were analyzed by immunohistochemical staining using SNA and MAA-I antibody, respectively. Black arrows indicate positive signals.

