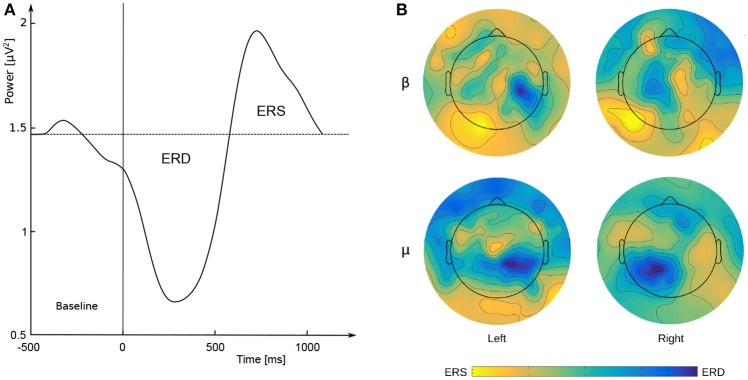
Figure 1.
(A) Example of ERD/ERS time courses. The vertical line indicates the beginning of imagery movement. Source: prepared by the authors, based on Lemm et al. (2009), p. 3; (B) maps of signal strength (μV2) distribution on the scalp (μ = 8–12 Hz; β = 18–30 Hz) during imagined movement of the left or right hand. Source: prepared by the authors.

