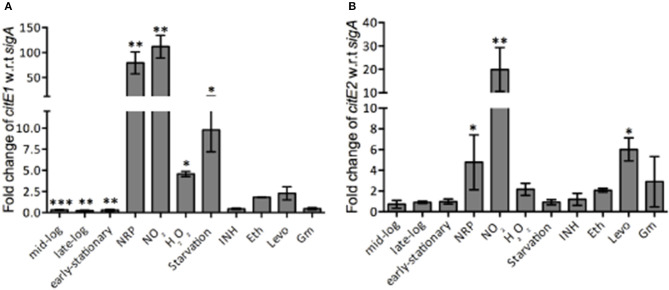
Figure 3.
qRT-PCR analysis to measure citE1 and citE2 transcript levels in different conditions. qRT-PCR was performed and the relative expression levels of citE1 (A) and citE2 (B) was quantified after normalization to levels of sigA in different growth stages and and upon exposure to different stress conditions or drugs as described in Materials and Methods. The data shown in this panel is mean ± S.E. of fold change obtained from three independent experiments. Significant differences were observed for the indicated groups (paired two-tailed t-test, *p < 0.05, **p < 0.01, ***p < 0.001).

