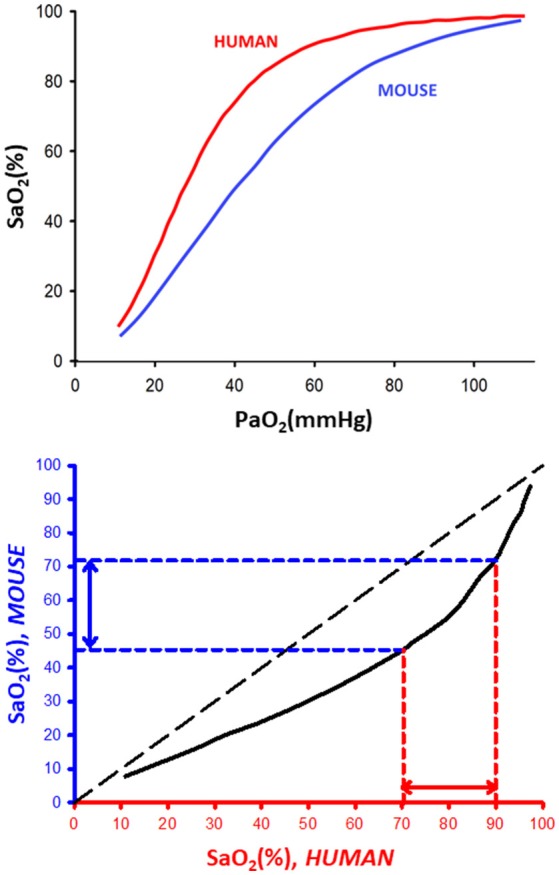
Figure 1.

(Top) Representative oxygen dissociation curves for human and mouse blood. SaO2 and PaO2: arterial oxygen saturation and partial pressure, respectively. The dissociation curves for human and mouse blood were redrawn from data in Severinghaus (1979) and Geng et al. (2016), respectively. (Bottom) Relationship between equivalent (same PaO2) values of SaO2 in human and mouse blood.
