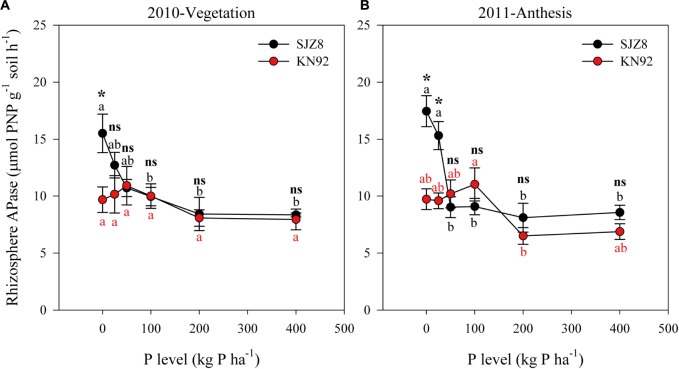
FIGURE 3.
APase activity in rhizosphere soil of SJZ8 (black) and KN92 (red) at vegetation stage in 2010 (A) and at anthesis stage in 2011 (B). Values are means ± SE of four replicates. Within each cultivar, different lowercase letters indicate significant difference between P application levels (Turkey test, P < 0.05); ns and ∗ indicate no significant difference and significant difference, respectively, between SJZ8 and KN92 at the same P application level (Student T-test, P < 0.05).

