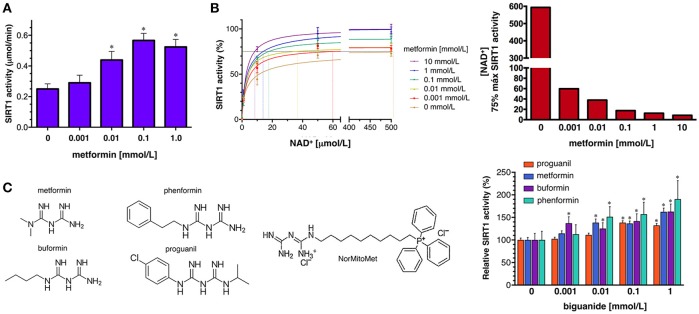
Figure 5.
Effects of metformin on the enzymatic activity of SIRT1. (A) Dose-response analyses of the effects of graded concentrations of metformin on the activity of SIRT1 using the SIRTainty assay. Columns and error bars represent mean values and S.D., respectively. Comparisons of means were performed by ANOVA; P < 0.01 were considered to be statistically significant (denoted as *). Data points are presented as mean ± SD; three technical replicates per n; n = 2 biochemical replicates (B) Left. Human recombinant SIRT1 enzyme was incubated with graded concentrations of NAD+ and indicated metformin concentrations in a cell-free system using the Epigenase™ Universal SIRT1 Activity/Inhibition Assay Kit (Fluorometric). Data points are presented as mean ± SD; three technical replicates per n; n = 2 biochemical replicates. Points are connected by best-fit lines using the Michaelis-Menten model (GrahPad Prism software). Right. NAD+ concentrations needed to achieve 75% of the maximal SIRT1 activity in the absence or presence of graded concentrations of metformin. (C) Left. Structural formulas of the compounds with the biguanide moiety highlighted in red. Right. Human recombinant SIRT1 enzyme was incubated with 10 μmol/L NAD+ in the absence or presence of graded concentrations of biguanides as in (B). Data points are presented as mean ± SD; three technical replicates per n; n = 2 biochemical replicates.

