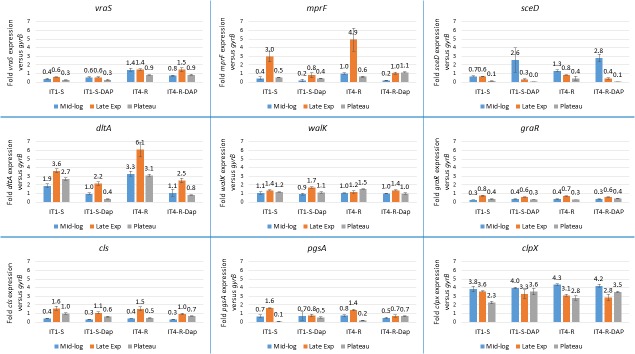
FIGURE 1.
Expression analysis of genes previously linked with DAP resistance. Transcript levels of the analyzed genes were determined by RT-qPCR in relation to gyrB expression. Values represent the mean of results obtained for three replicates independently grown cultures for each isolate. Error bars indicate the standard deviation of comparisons between three replicates. IT1-S – isolate IT1-S grown in the absence of DAP, IT1-S-DAP – isolate IT1-S grown in the presence of 0.08 μg/ml daptomycin, IT4-R – isolate grown in the absence of daptomycin, IT4-R-DAP – isolate IT1-S grown in the presence of 0.08 μg/ml daptomycin. Mid-log, mid-exponential growth phase; Late Exp, late exponential growth phase; Plateau, stationary growth phase.

