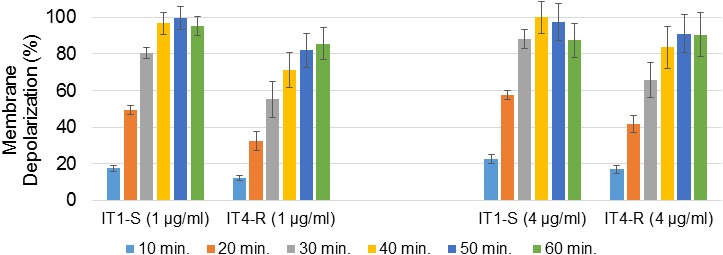
FIGURE 3.

DAP-induced membrane depolarization. The graph shows percentage of membrane depolarization after 10, 20, 30, 40, 50, and 60 min of the antibiotic treatment. DAP concentrations in brackets. The data represent the means from three technical replicates. Error bars indicate the standard deviation of comparisons between three technical replicates.
