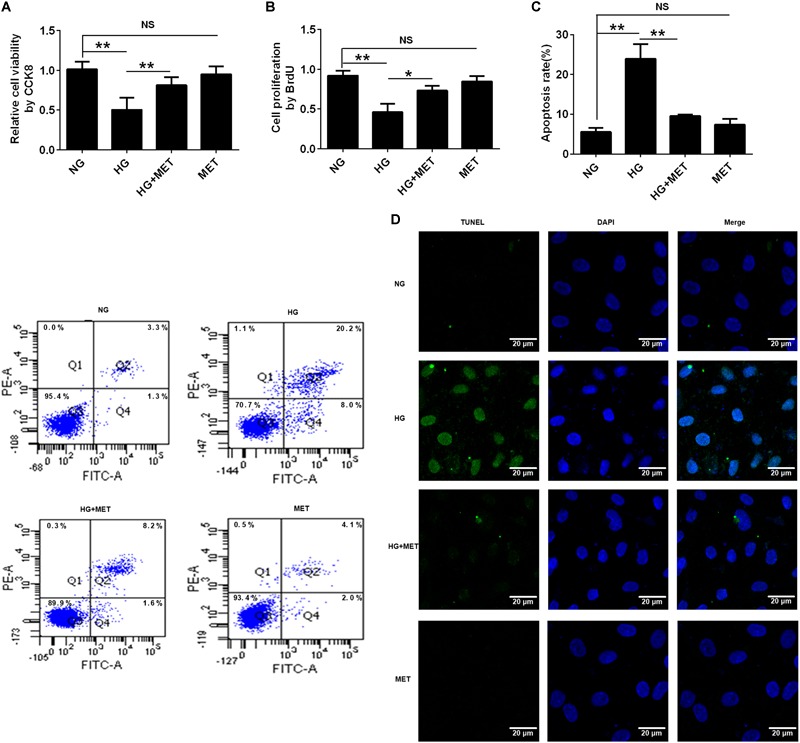
FIGURE 3.

The effects of metformin on HUVEC cell proliferation and apoptosis in response to HG treatment. (A) CCK8 assay in HUVECs treated with NG, HG (33.3 mmol/l), HG plus 0.01 mmol/l metformin (HG + MET), and MET (0.01 mmol/l) conditions. (B) BrdU incorporation assay in HUVECs treated with NG, HG, HG + MET, and MET. (C) Annexin V/PI assay in HUVECs treated with NG, HG, HG + MET, and MET. The histograms represent the apoptosis rates in the four groups. (D) Representative photographs of TUNEL staining in the different groups. The results are expressed as the means ± SD. ∗p < 0.05, ∗∗p < 0.01; NS, not significant; one-way ANOVA.
