
FIGURE 5.
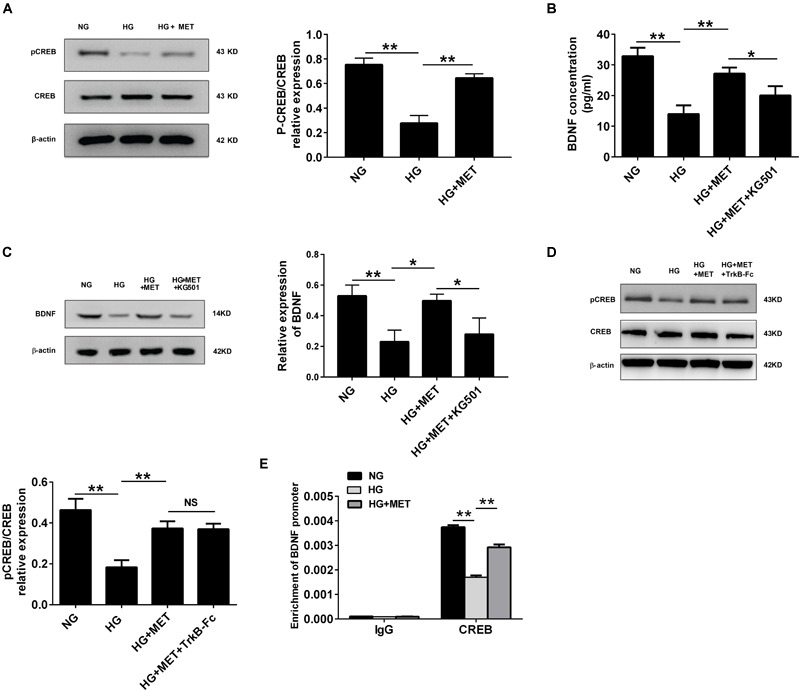
BDNF expression was regulated by metformin through CREB activation. (A) Western blot analysis of CREB and pCREB expression in HUVECs treated with NG, HG (33.3 mmol/l), and HG + MET (0.01 mmol/l) conditions. Histograms represent the relative pCREB/CREB intensity. (B) ELISA analysis of BDNF expression in HUVECs treated with the NG, HG, HG + MET, and HG + MET plus 25 μM KG501 (HG + MET + KG501) conditions for 24 h. (C) Western blot analysis of BDNF expression in HUVECs treated with NG, HG, HG + MET, and HG + MET + KG501. Histograms represent the relative BDNF intensity. (D) Western blot analysis of CREB and pCREB expression in HUVECs treated with NG, HG, HG + MET, and HG + MET + TrkB-Fc. Histograms represent the relative pCREB/CREB intensity. (E) Detection of CREB binding in BDNF promoter regions by chromatin immunoprecipitation (ChIP) assay in HUVECs. Human IgG was used as a negative control. The results are expressed as the means ± SD. ∗p < 0.05, ∗∗p < 0.01; NS, not significant; one-way ANOVA.