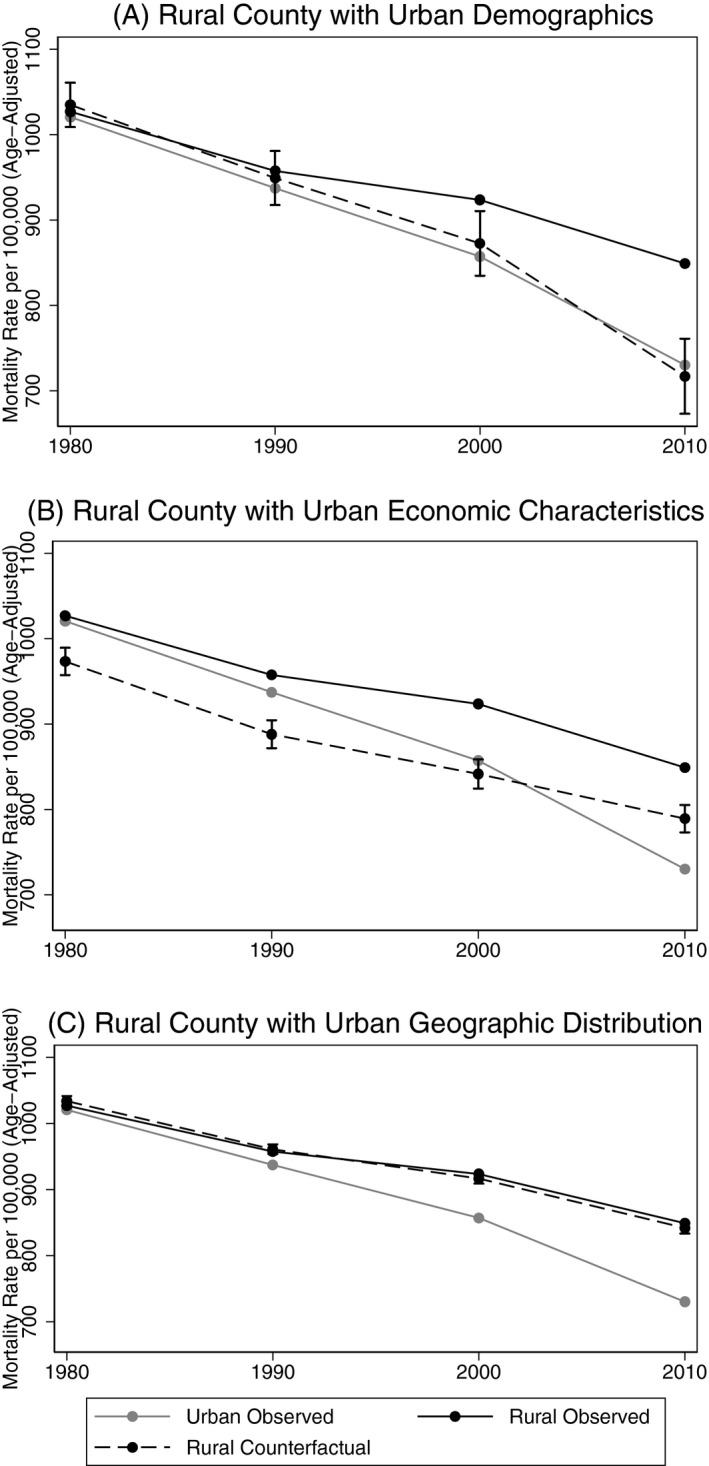
Figure 2.

- Notes. Dashed line represents predicted age‐adjusted mortality rate for a county with coefficients from urban regression estimates and characteristics replaced with those of a rural county within each category. Demographic characteristics include racial and ethnic composition, foreign‐born population, and net migration rate. Economic characteristics include education, poverty, and unemployment. Geographic distribution is percent of counties in each census region. Bars represented 95% confidence intervals generated through 500 bootstrapped replications of the prediction.
