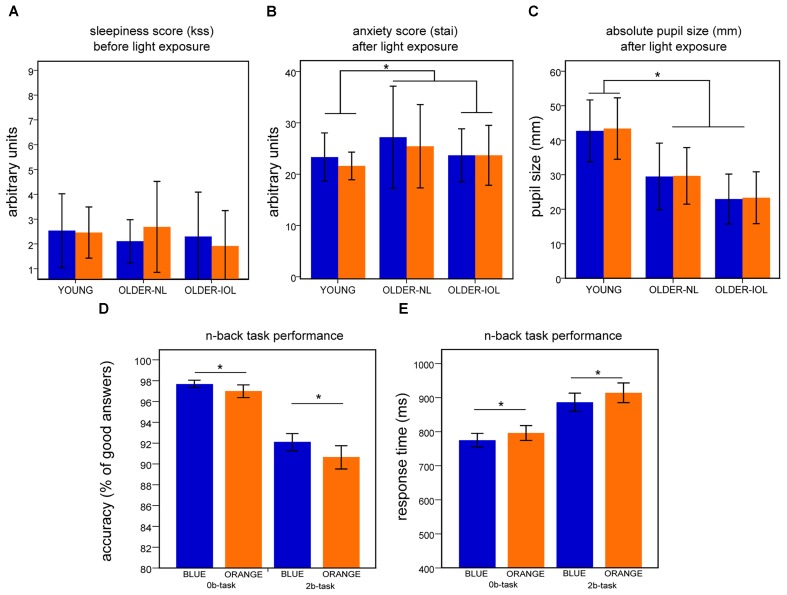
FIGURE 2.
Behavioral results. For each panel (A–E), results represent mean ± standard error of the mean (SEM) for both light conditions. (A) Score on the Karolinska (KSS) sleepiness scale before the fMRI session. (B) Score on the State Anxiety questionnaire (STAI-S) after each fMRI session. (C) Dilated absolute pupil size (mm) after each fMRI session. (D) Accuracy on the 2b and 0b tasks when all subjects are pooled together. (E) Response time to 2b and 0b tasks when all subjects are pooled together;∗ indicates significant differences between groups or light conditions.

