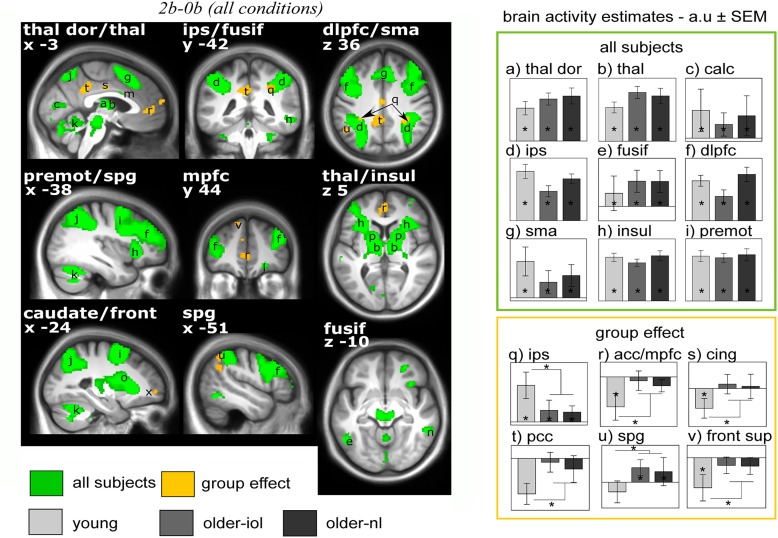
FIGURE 3.
Brain responses to the n-back tasks [2b-0b] irrespective of the light conditions. Statistical results (P < 0.05 FWE-whole brain) overlay the mean structural image of all participants. Significant responses to the task common to all groups are displayed in green while group differences (older-nl and older-iol > younger; younger > older-nl and older-iol) are in yellow. See Table 2 for brain regions corresponding to the letters and abbreviations. Right panels show activity estimates (arbitrary unit – a.u. ± SEM) for each brain region. ∗ Significant group differences P < 0.05 corrected FWE-whole brain.

