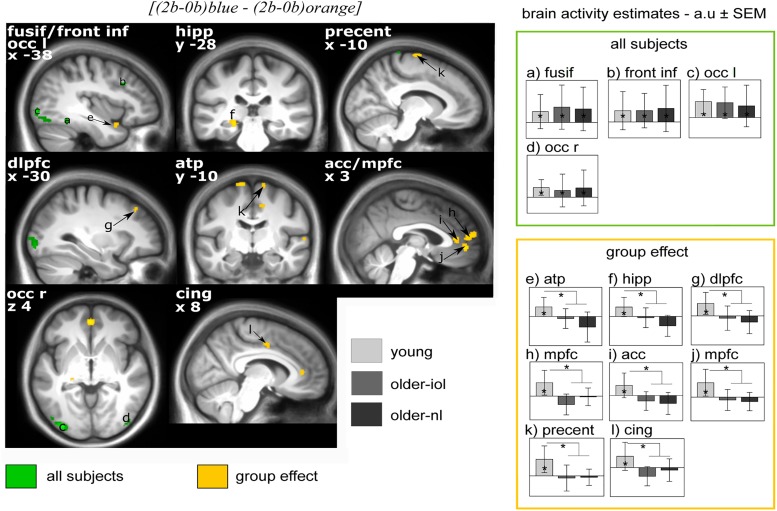
FIGURE 4.
Effect of [(2b-0b)blue – (2b-0b)orange] on brain responses in young, older-nl, and older-iol subjects. Statistical results (P < 0.001 uncorrected) overlay the mean structural image of all participants. Responses to light are displayed in green for all subjects pooled together, whereas group differences (young > older-nl and older-iol) are displayed in yellow. Right panels show activity estimates (a.u. ± SEM) for each brain region. See Table 3 for brain regions corresponding to the letters and abbreviations. ∗ Significant group differences P < 0.05 corrected for multiple comparisons over small volumes of interest taken a priori location based on the literature.

