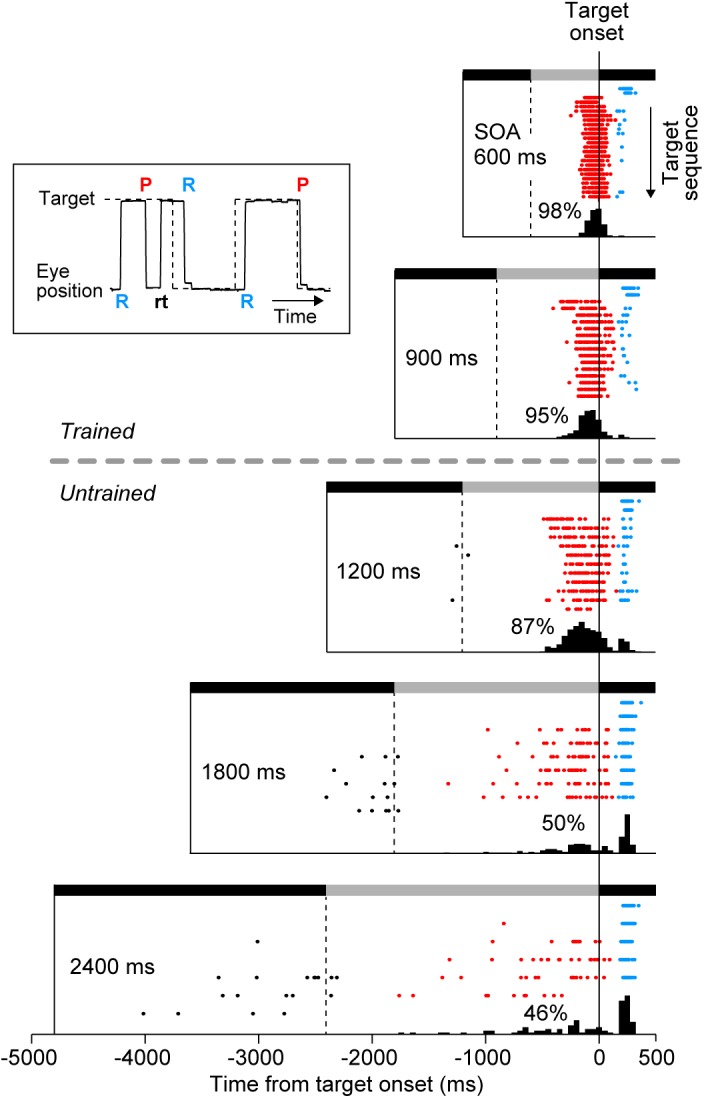
FIGURE 2.

Distribution of saccade latency in a representative experiment. Inset plots a sample record of eye and target position, and shows the definition of three types of saccades. “P” and “R” indicate the onsets of predictive and reactive saccades, respectively. Reactive saccades were generated within 150–500 ms following the target onset. Predictive saccades were directed away from the current target and toward the upcoming target, and were sometimes followed by return saccades (“rt,” black). Predictive saccades were also directed toward the target when generated within 150 ms following the target onset. Rasters plot saccade timing in the direction of the target (target onset is at time zero). Each row of the raster plots corresponds to the target sequence in many trials, with the first target in the trial shown at the top of raster lines. Note that saccades for the initial two targets were always reactive (blue dots) because the SOA varied from trial to trial. Black and gray horizontal bars indicate target locations that alternated at the SOA. Histograms below the rasters indicate the distribution of saccade latency for the third and subsequent targets. Numbers indicate the proportions of predictive saccades computed for the third and later saccades in the sequence.
