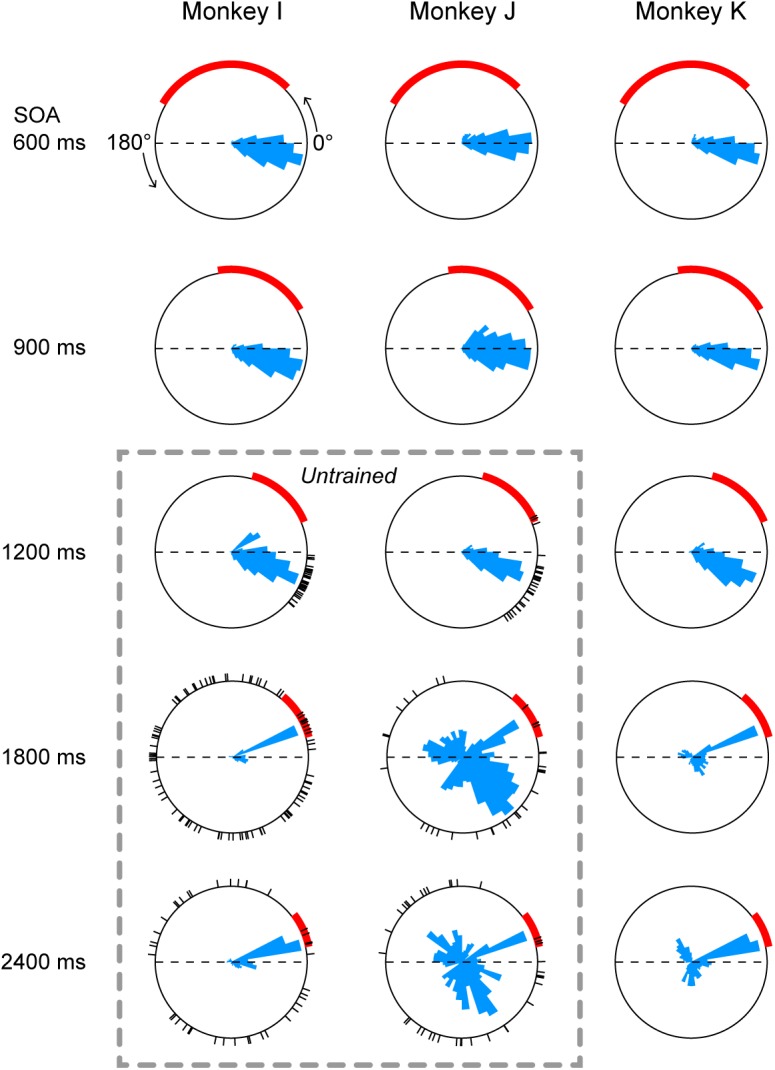
FIGURE 3.

Circular histograms of saccade timing in all conditions. Each panel plots the data obtained from three daily sessions. 0° indicates target onset in the direction of saccade, while 180° indicates target onset in the opposite direction (thus the arc between 0° and 180° represents one SOA). Red arcs indicate the range of reactive saccade latency (150–500 ms after target onset). The circular histogram on each panel is normalized for its peak value. Dashed rectangle indicates untrained conditions. Black short lines on the circles indicate saccade timing relative to the target onset in the first three trials during the very first session of the untrained sequence.
