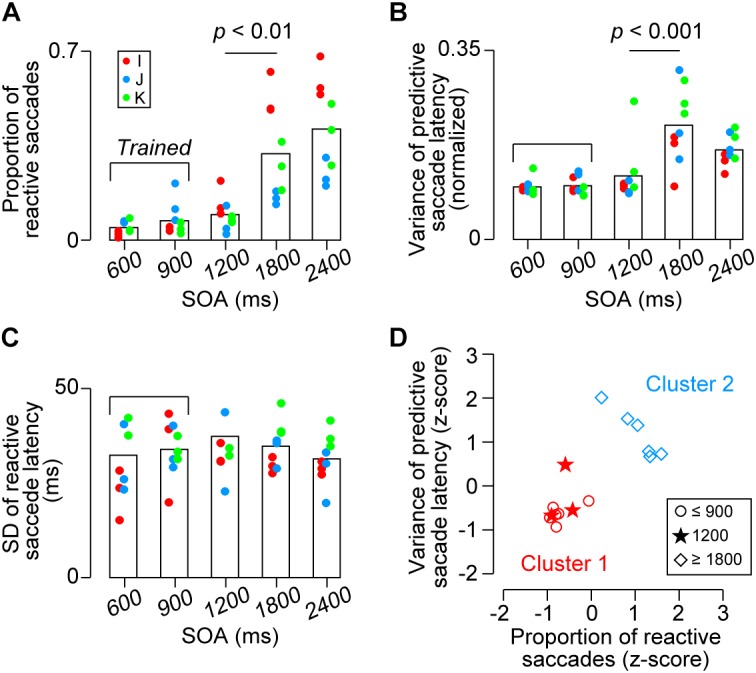
FIGURE 5.

Quantitative data. (A) Proportion of reactive saccades. Bracket indicates trained SOAs for monkeys I and J (600 and 900 ms). (B) Normalized variance of predictive saccade latency (SD divided by SOA). (C) Variance of reactive saccade latencies. Note that the values in A and B were significantly greater for the 1800 and 2400 ms conditions than the other conditions (ps < 0.01), while no significant difference was found across conditions in (C) (ps > 0.99). (D) Classification of the data shown in (A,B) for each monkey. Different shapes of symbols indicate SOA conditions. Colors indicate the results of k-means clustering and show that the behavioral performance for the short SOAs (600 and 900 ms, trained sequence, red circles) differed from that for the long SOAs (1800 and 2400 ms, untrained, blue diamonds). Note that the data for the novel 1200-ms sequence were grouped into the trained condition (red stars).
