
FIG 9.
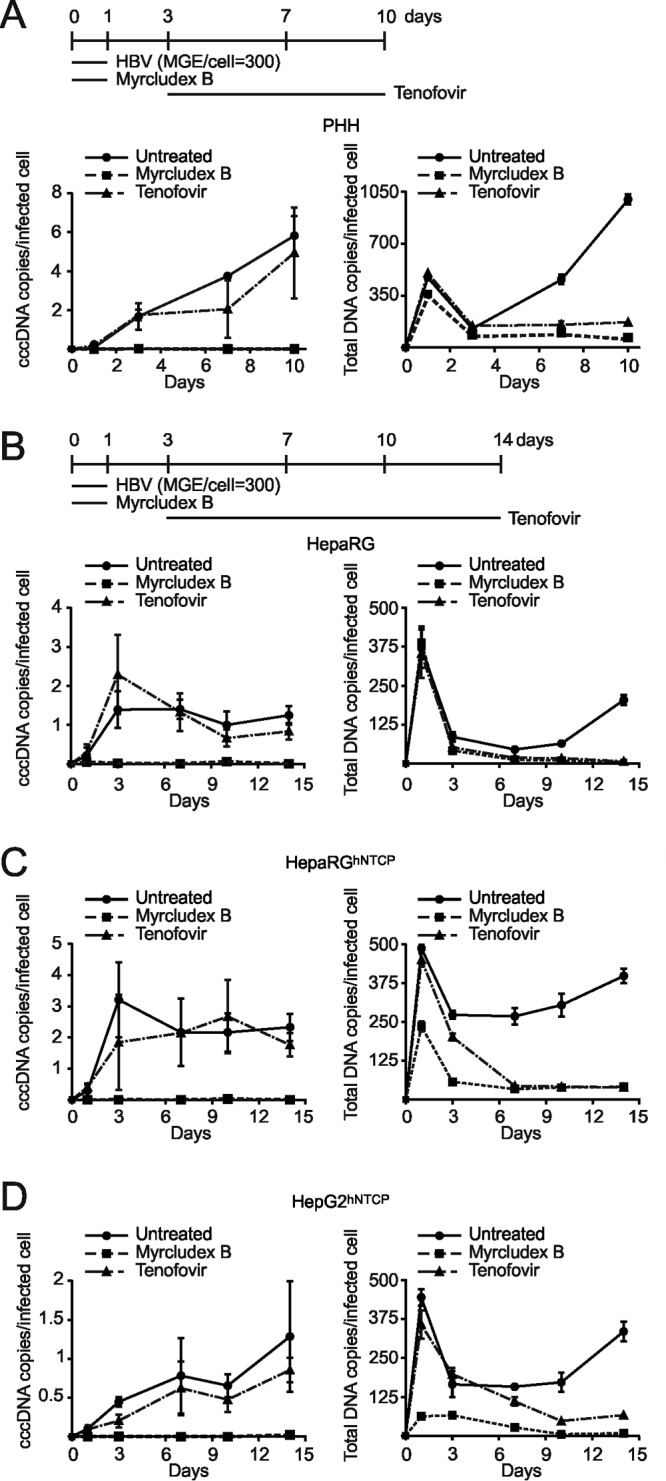
Comparability of cccDNA formation and accumulation in different in vitro infection systems. In vitro infections with a moderate mge (mge/cell of 300) were performed in PHH (A), differentiated HepaRG cells (B), differentiated HepaRGhNTCP cells (C), and HepG2hNTCP cells (D). Myrcludex B (1 μM) and tenofovir (15 μM) were implemented as controls as shown in the timelines. For PHH, total DNA was extracted on days 1, 3, 7, and 10 p.i.; for the other cell lines, samples were collected until day 14 p.i. To measure the respective infection rates, cell counting of HBcAg-positive cells was performed (Fig. 8B). Undigested DNA samples were directly used for total HBV DNA as well as human β-globin quantification. T5 Exo treatment (37°C, 5 U, 60 min) was performed prior to cccDNA quantification. cccDNA copy number was normalized by a factor that was derived from β-globin level to eliminate variation from inputs and further calculated as number of cccDNA copies/cell. Finally, the value of cccDNA copies per infected cell was determined by using number of cccDNA copies/cell to divide elution ratio and infectivity ratio (Fig. 8).