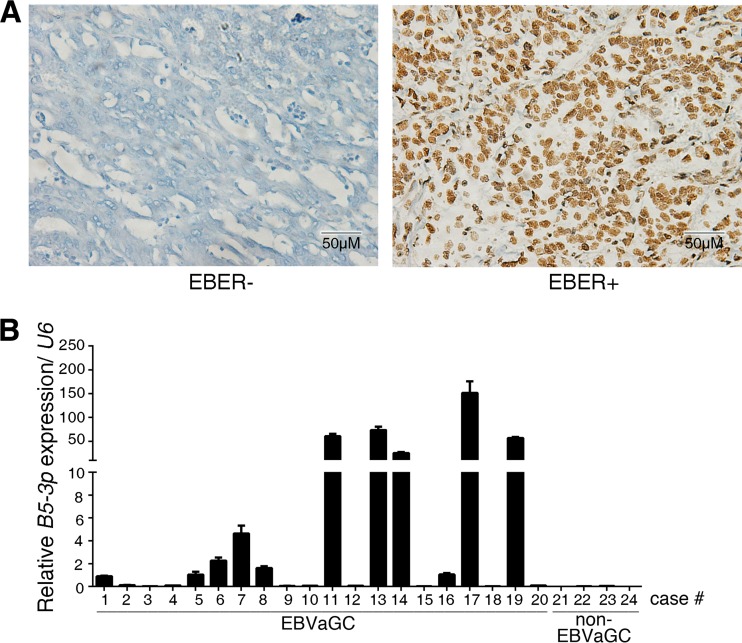
FIG 7.
BART5-3p expression in EBVaGC clinical specimens. (A) Representative images of EBER staining by means of in situ hybridization. Shown are EBER-negative (left) and EBER-positive (right) gastric cancer specimens. (B) The transcriptional levels of BART5-3p in specimens from 20 cases of EBVaGC (numbered 1 to 20) and 4 cases of non-EBVaGC (numbered 21 to 24) were determined by stem-loop RT-qPCR. The expression values of case number 1 are set as 1 for BART5-3p. U6 was used for normalizing the expression of BART5-3p.

