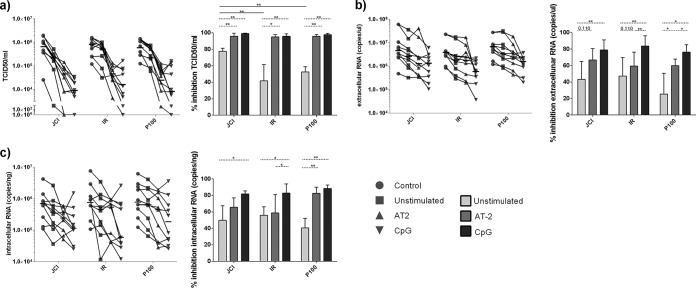
FIG 2.
Inhibition of HCV replication by pDCs. (a) TCID50 per milliliter (infectivity) (left) and percentage of TCID50 per milliliter of inhibition (right). (b) Extracellular RNA production (left) and percentage of extracellular RNA inhibition (right). (c) Intracellular RNA production (left) and percentage of intracellular RNA inhibition (right). Percentages of inhibition were calculated with respect to the corresponding virus Huh7.5 infection without pDC addition (“control”). Lines that link the different conditions correspond to experiments made with pDCs from the same donor. Results are expressed as medians with ranges from 10 independent experiments. Continuous lines correspond to Mann-Whitney U tests, and dotted lines correspond to the Wilcoxon test. Statistical values are shown by asterisks as follows: *, P = 0.05 to 0.01; and **, P = 0.01 to 0.001.

