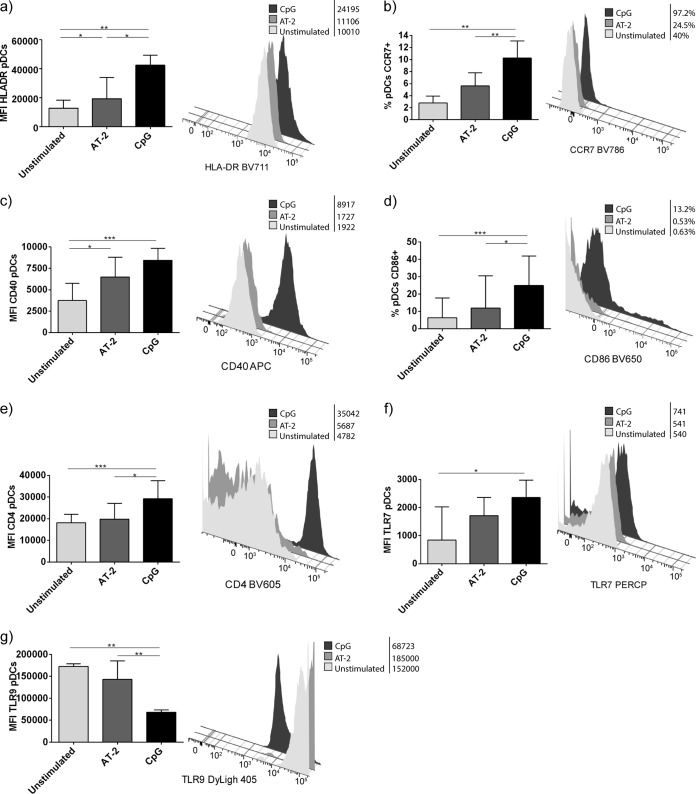
FIG 6.
Phenotype of pDCs after coculture. Shown are flow cytometry data from pDCs after coculture, expressed as percentage or mean fluorescence intensity (MFI). Results are expressed as medians with ranges from six independent experiments. Histograms of a representative experiment are presented. Continuous lines correspond to Mann-Whitney U tests. Statistical values are shown by asterisks as follows: *, P = 0.05 to 0.01; **, P = 0.01 to 0.001; and ***, P < 0.001.

