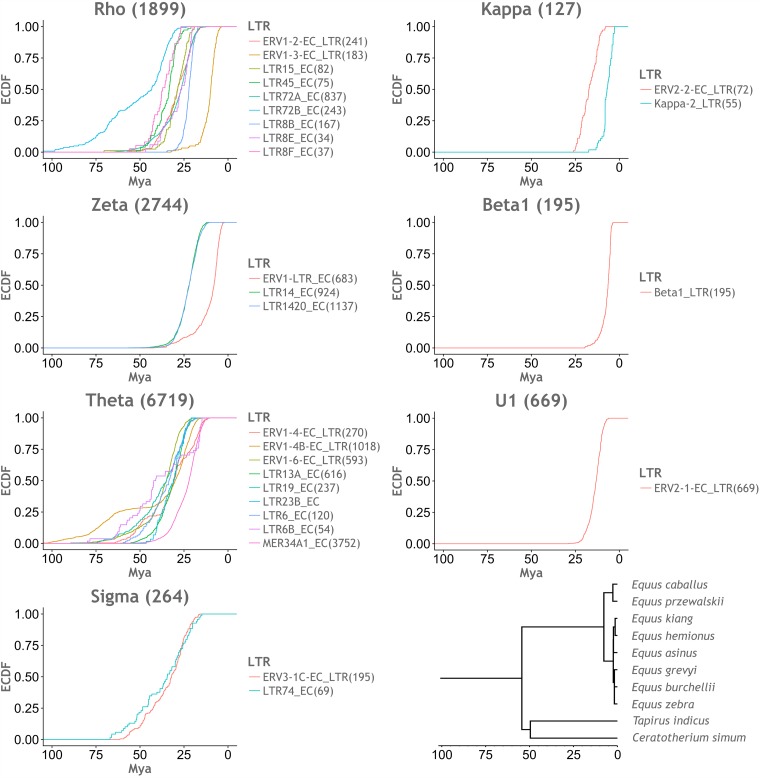
FIG 4.
Inferred timeline of ERV lineage expansions. Empirical cumulative distribution function (ECDF) plots, representing the accumulation of observed LTRs over time. The ages of LTRs were inferred by estimating divergence from an LTR consensus sequence and applying a molecular clock-based calibration. The x axes show time in millions of years before the present (millions years ago [Mya]), and the y axes show the proportion of LTR sequences accumulated. Distinct LTR groups found to occur within the same ERV lineage are shown within the same plot, using distinct colors as indicated by the color key for the plot. All x axes were adjusted to the same scale. (Bottom right) Time-scaled perissodactyl phylogeny obtained from the TimeTree website (69).

