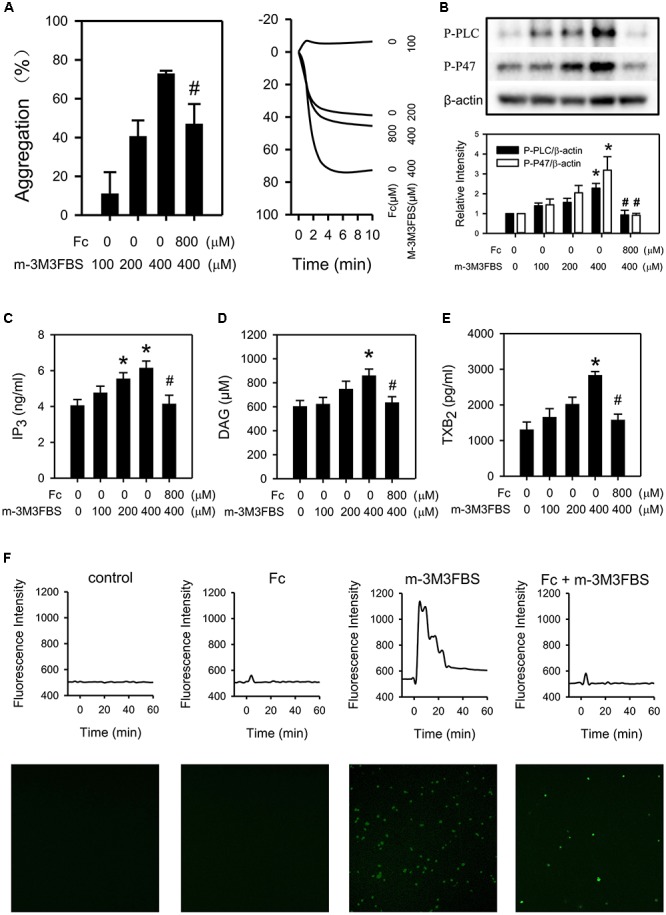
FIGURE 5.

Involvement of PLCγ2 cascade in the antiplatelet effect of Fc. WP were treated with either increasing concentrations of m-3M3FBS (100, 200, 400 μM) or m-3M3FBS (400 μM) followed Fc (800 μM). (A) Platelet aggregation was assessed by a 4-channed aggregometer. (B) The phosphorylation of PLCγ2 and P47 of platelet were measured with western blotting. β-actin was used as a loading control. Platelet IP3 (C), DAG (D), and TXB2 (E) concentrations were assessed by ELISA kits. (F) [Ca2+] was assessed by the fluorescence intensity from intracellular Fluo-4. The images are from the peak point of each experiment. Tracings were from representative results in three independent experiments. Values are mean ± SEM (n = 6∼11 for A; n = 3∼4 for B–E). ∗P < 0.05 versus control; #P < 0.05 versus 400 μM m-3M3FBS only.
