FIGURE 6.
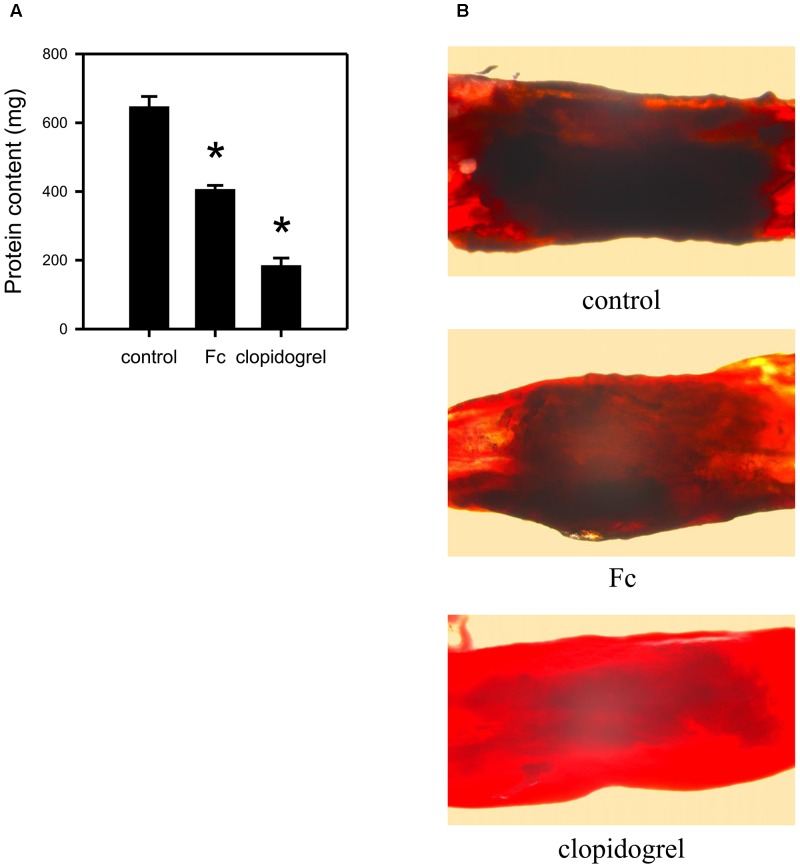
In vivo anti-thrombotic effect of Fc. Rats were i.p. injected with saline, Fc or clopidogrel. 2 h later, a filter paper saturated with 20% FeCl3 was applied to the isolated femoral artery for 20 min. Then the injured arteries were isolated for observation under microscope and measurement of thrombus protein content. (A) The bar graph indicates the protein contents in FeCl3 induced thrombus of each group. (B) The representative graphs showed the artery condition after injured by FeCl3. Values are mean ± SEM (n = 6 for control and Fc group; n = 3 for clopidogrel group). ∗P < 0.05 versus control.

