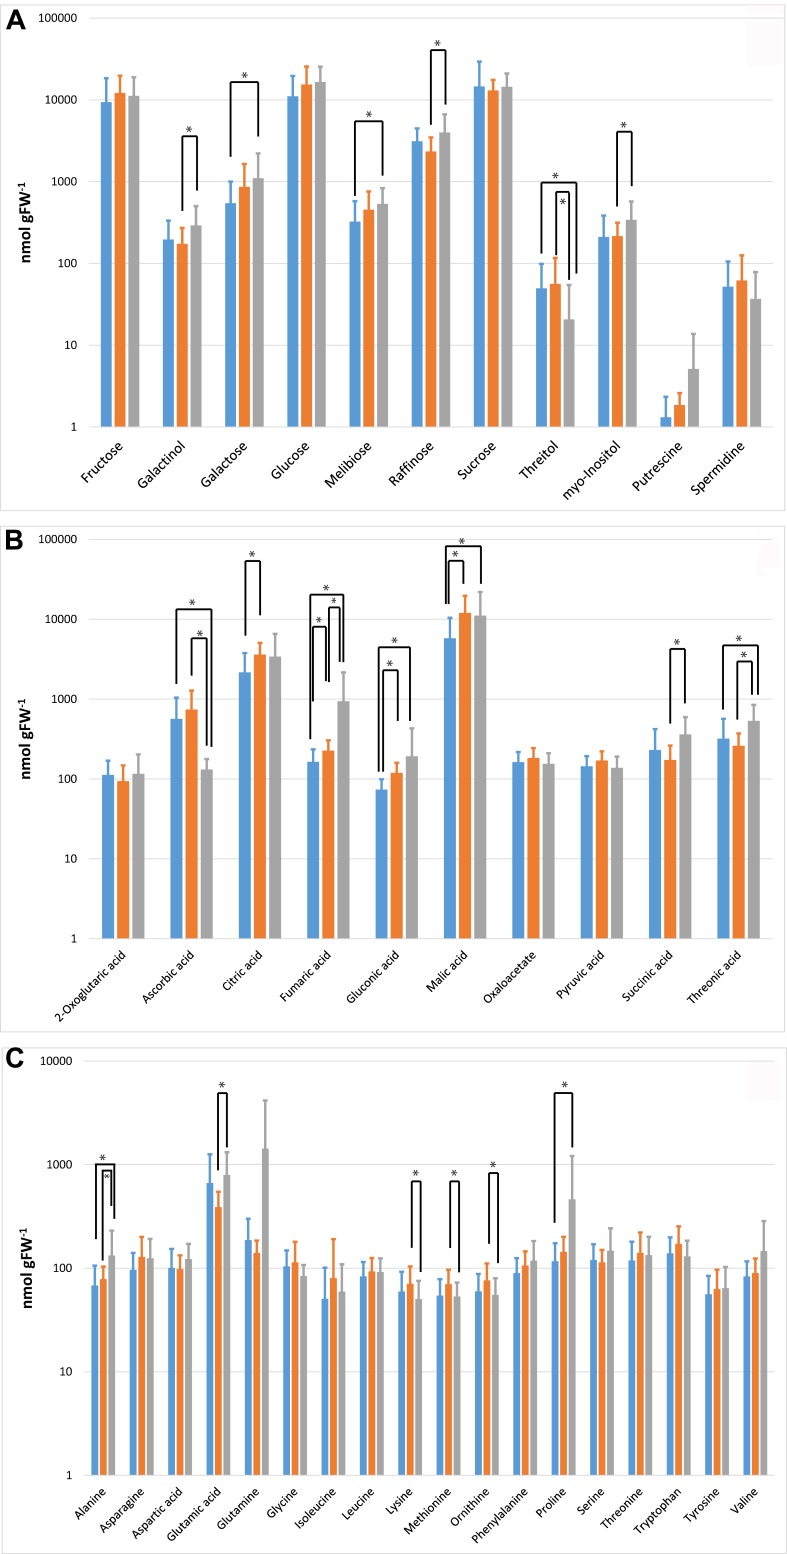
FIGURE 3.
Absolute levels of primary metabolites. Metabolites are grouped according to the substance classes of (A) sugars, sugar alcohols, and polyamines; (B) organic acids; (C) amino acids. Significant differences evaluated by ANOVA are indicated by asterisks (∗p < 0.05). Metabolite levels from samples of OOE1 are indicated by blue bars, OOE2 by orange bars, and OOE3 by gray bars.

