FIGURE 4.

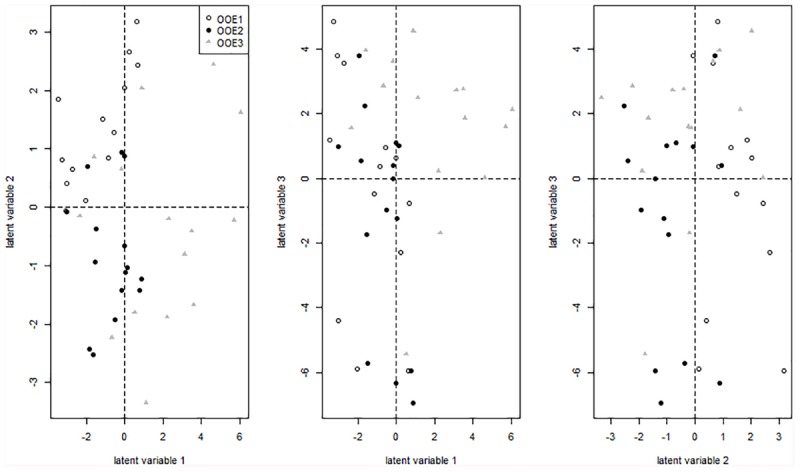
Projection of samples on latent variables of the primary metabolite matrix (GC-MS data) after sPLS regression. Detailed information on the loadings are provided in the supplement (Supplementary Table S1).

Projection of samples on latent variables of the primary metabolite matrix (GC-MS data) after sPLS regression. Detailed information on the loadings are provided in the supplement (Supplementary Table S1).