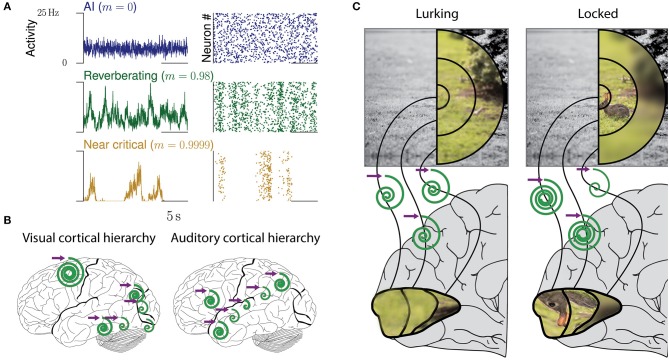
Figure 1.
Collective dynamics of cortical networks. (A) Examples of collective spiking dynamics representing either irregular and uncorrelated activity (blue), reverberations (green), or dynamics close to a critical state (yellow). Population spiking activity and raster plots of 50 neurons are shown. (B) Hierarchical organization of collective cortical dynamics. In primary sensory areas, input is maintained and integrated only for tens of milliseconds, whereas higher areas show longer reverberations and integration. The purple arrow represents any input to the respective area, the spirals the maintenance of the input over time (inspired from Hasson et al., 2015). (C) Dynamic adaptation of collective dynamics in local circuits. When a predator is lurking for prey, the whole field of view needs to be presented equally in cortex. Upon locking on prey, attention focuses on the prey. This could be realized by local adaptation of the network dynamics, which amplifies the inputs from the receptive fields representing the rabbit (“tuning in”), while quenching others (“tuning out”).

