
Figure 2.
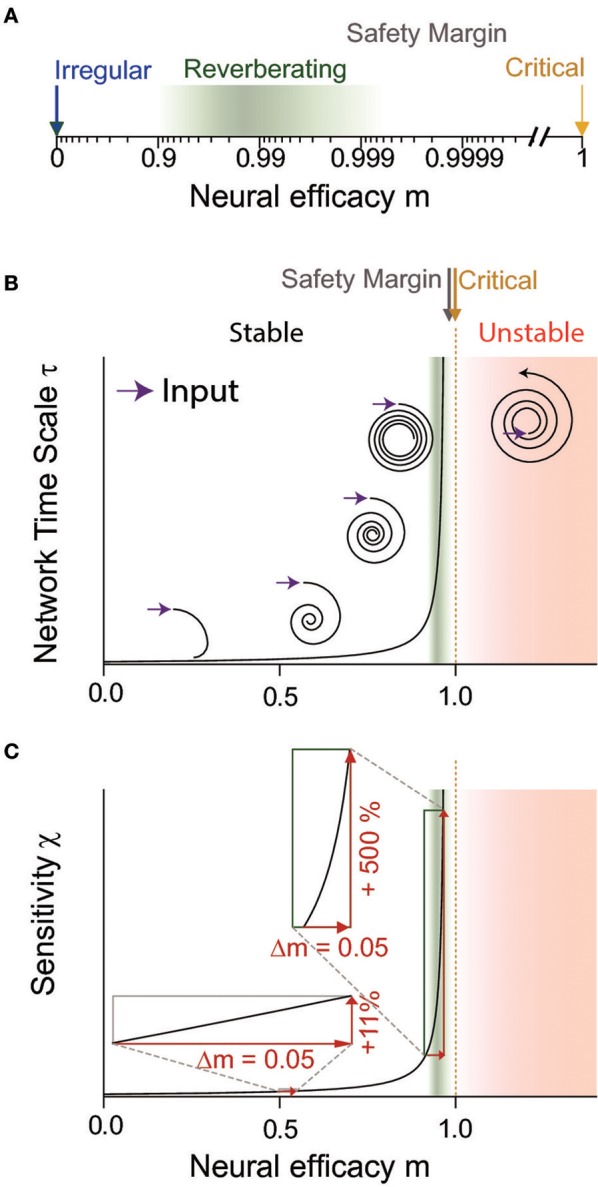
The neural efficacy m determines the average impact any spike has on the network. Depending on m, network dynamics can range from irregular (m = 0) to critical (m = 1) and unstable (m > 1) dynamics. (A) In a logarithmic depiction of m, the “reverberating regime” (green) observed for cortex in vivo is well visible. It has clearly a larger m than the irregular state (blue), but maintains a safety margin to criticality (yellow) and the instability associated with the supercritical regime (red in B,C). (B,C) Sketch to illustrate the divergence of dynamical and computational properties at a critical phase transition, at the example of the network timescale and the sensitivity, respectively. (B) The network timescale determines how long input is maintained in the network. While any rate change is rapidly quenched close to the irregular state (m = 0), input “reverberates” in the network activity for increasingly long timescales when approaching criticality (m = 1). In the reverberating regime, the network timescale is tens to hundreds of milliseconds. For m > 1, input is amplified by the network, implying instability (assuming a supercritical Hopf bifurcation here for illustration). The reverberating regime keeps a sufficient safety margin from this instability. (C) The reverberating regime found in vivo allows large tuning of the sensitivity by small changes of the neural efficacies (e.g., synaptic strength or excitation-inhibition balance), in contrast to states further away from criticality (insets).