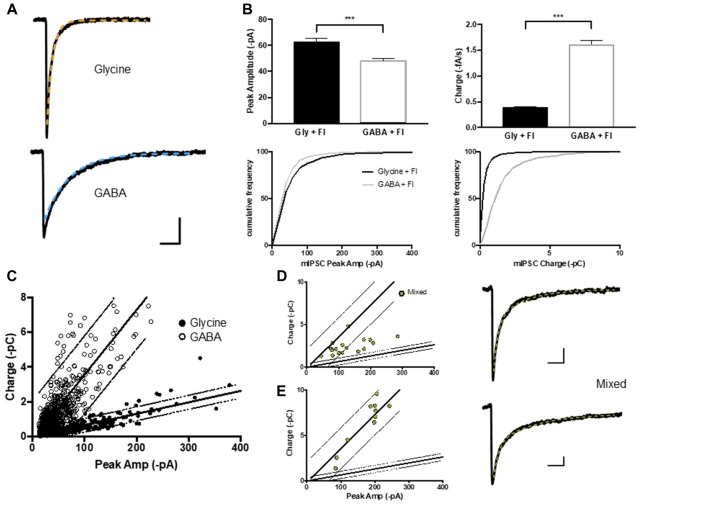
Figure 2.
GABA, glycine and mIPSCs were defined on the basis of their peak current and charge transfer. (A) Average current traces of glycinergic and GABAergic mIPCs were recorded in whole-cell configuration in the presence strychnine or SR95331 and decays fitted with a single exponential (orange and blue) respectively. (B,C) The peak current (I) to charge ratio of GABA and glycine mIPSC (n = 600 events from 15 neurons each) were used to define 95% prediction intervals (gray lines) for these two mIPSC phenotypes. (D,E) Two example populations of mixed mIPSCs recorded in the absence of strychnine or SR 95331 and selected on the basis of their biphasic decay current (double exponential fit (green)). Mixed mIPSCs mapped between the two 95% prediction intervals or were misidentified as GABAergic, depending on the size of their GABA component.

