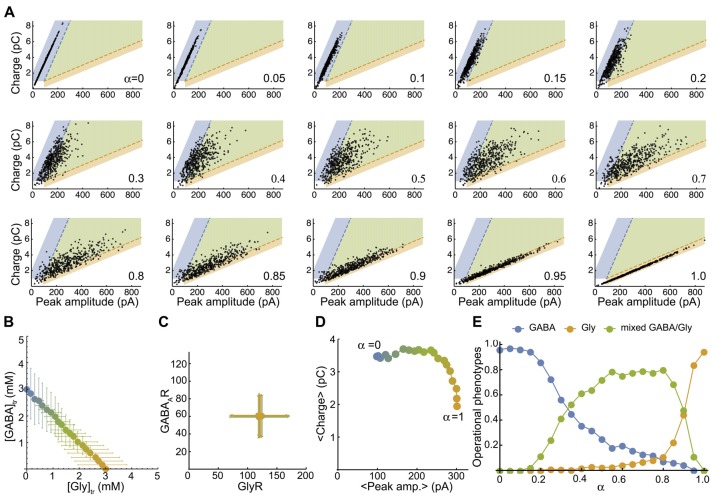
Figure 4.
The simulated mixed mIPSC phenotypes shifts as function of the proportion of glycine and GABA coreleased. (A) Simulated-mIPSC charge-amplitude distribution for increasing α values. Each panel shows the charge-amplitude distribution of 500 randomly simulated mIPSCs for the α value indicated. We defined three areas as GABAergic (blue), glycinergic (orange) and mixed (green) to operationally sort individual mIPSC phenotypes with similar threshold criteria that were used experimentally. (B) Parametric plot of the average GABA-glycine peak concentration in the transient as function of α. Each value was randomly generated from normal distributions as function of α with CVAAN = 0.4 ([gly]: 3 α ± 1.2 α mM and [GABA] = 3 (1−α) ± 1.2 (1-α) mM). (C) Plot of the average number of GABAAR-GlyR randomly generated from normal distributions with CVR = 0.4 (120 ± 48 GlyRs and 60 ± 24 GABAARs). (D) Plot of the average charge-peak amplitude. (E) Proportions of GABAergic, glycinergic and mixed phenotypes of simulated mIPSCs as function of α. Each point in (B–D) represents the average value of the distribution for an α value and the color blend is a linear function of α between pure GABA (3 mM, blue, a = 0) and pure glycine (3 mM, orange, α = 1). Figure 4A has been reproduced from Aubrey et al. (2007).

