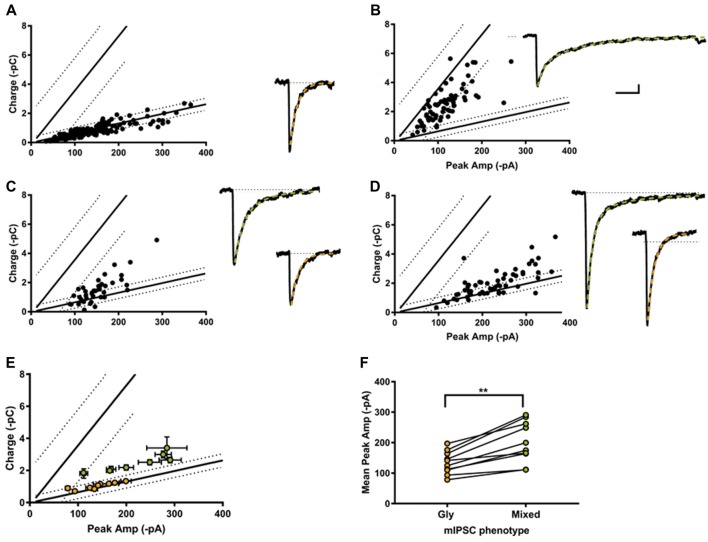
Figure 5.
Most individual inhibitory synapses had a combination phenotype comprised of both glycine and mixed mIPSCs. Examples of single synapse peak amplitude-charge relationships (left) and average mIPSCs (10 events each, right) with their decay current fitted with a single (orange) or double exponential (green). 4/18 of the recorded synapses were purely glycinergic (A), and 5/18 were purely mixed (B). The other 9/18 synapses displayed a combination of mixed and glycine mIPSCs (C,D). (E) Average peak current-charge relationship of the glycine (orange) and mixed (green) mIPSCs identified in the nine combination synapses. (F) Glycine mIPSC peak amplitudes were always smaller than the mixed mIPSC peak amplitude, as expected from a compound GABA+glycine mIPSC event.

