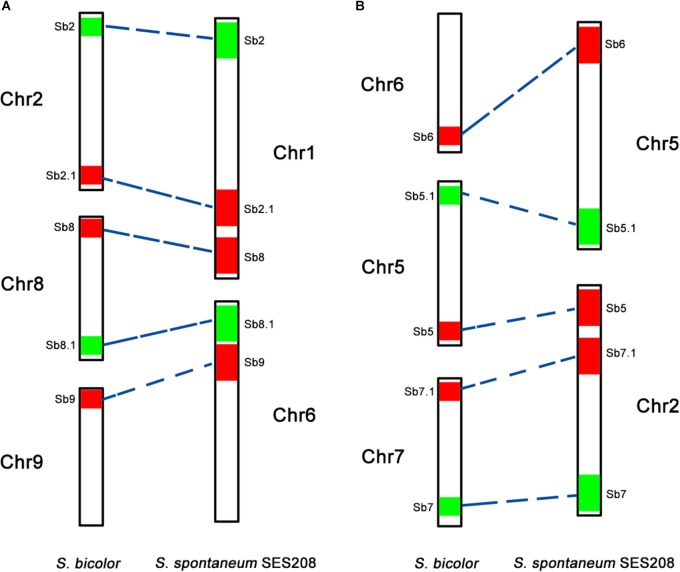
FIGURE 4.
A schematic illustration of chromosomal rearrangements between sorghum and S. spontaneum. (A,B) Represent two chromosome rearrangement events involving sorghum chromosomes 2, 8, and 9, and sorghum chromosomes 6, 5, and 7, respectively. The chromosomes are depicted according to the oligo FISH results as shown in Figures 2, 3. The color bars represent the signals produced by the oligo probe. The relative length of each chromosome were drawn based on the data of the sorghum genome and Table 2.

