
FIGURE 2.
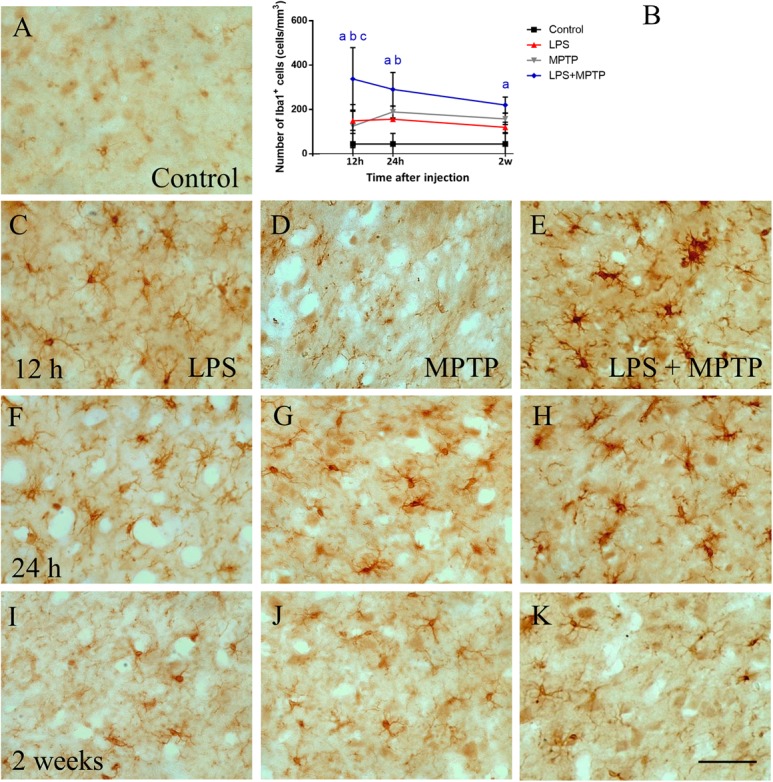
Effect of LPS and MPTP on the activation of microglia in the SN. Coronal sections showing Iba-1 immunoreactivity in the SN. (A) Control animals. (C,F,I) Animals treated with LPS during 12 h, 24 h, and 2 weeks, respectively. Note that LPS increase microglial activation, especially after 12 h. (D,G,J) Animals treated with MPTP during 12 h, 24 h, and 2 weeks, respectively. (E,H,K) Animals treated with both LPS and MPTP during 12 h, 24 h, and 2 weeks, respectively. Note that LPS highly increases the microglia activation response to MPTP injection. Scale bar: 50 μm. (B) Quantification of Iba-1-positive cells in the SN of rats. Results are mean ± SD of at least three independent experiments and are expressed as cell/mm2. One-way ANOVA followed by the Fischer’s LSD post hoc test for multiple comparisons was used for statistical analysis, with α = 0.05: a, compared with the control; b, compared with the LPS group; c, compared with the MPTP group; p < 0.001.