
FIGURE 4.
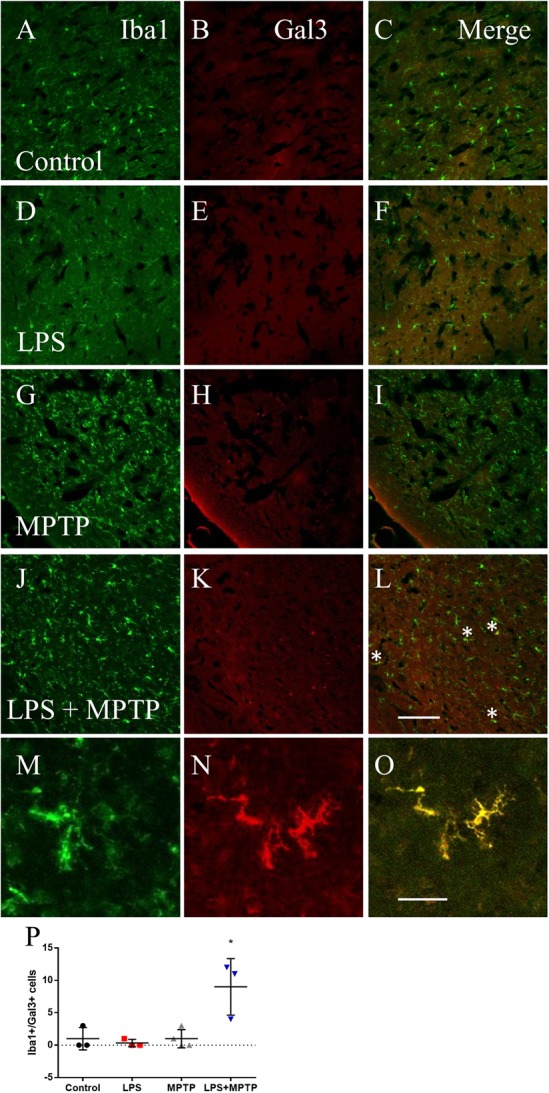
Lipopolysaccharide/MPTP induce the appearance of galectin-3 (Gal3)-expressing microglial cells in SN. Immunofluorescence for Iba1 (A,D,G,J,M) and Gal3 (B,E,H,K,N) in the different treatment assayed. Only LPS/MPTP group shows a clear expression of Gal3 microglial cells (merged images, C,F,I,L,O). Scale bar: 100 μm. (M–O) Shows high magnification pictures of Iba-1, Gal3 and merge image of the LPS/MPTP group. Scale bar: 500 μm. (P) Quantification of Iba-1/Gal3 co-localizing cells in the different treatment assayed. Results are mean ± SD of at least three independent experiments and are expressed as number of cells. One-way ANOVA followed by the Fischer’s LSD post hoc test for multiple comparisons was used for statistical analysis, with α = 0.05: ∗, compared with the control; p < 0.05.