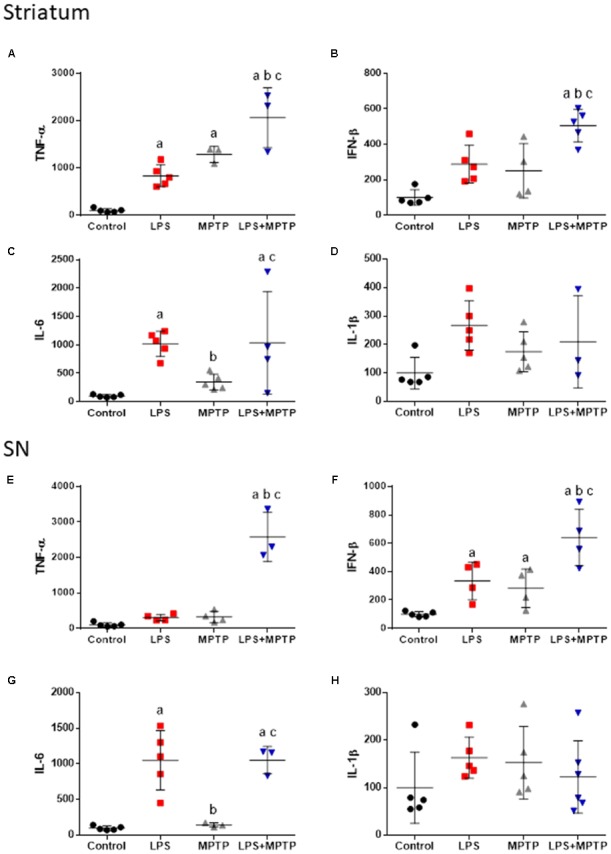
FIGURE 5.

Effect of LPS and MPTP on the expression of TNF-α, IFN-β, IL-1β, and IL-6 mRNAs in the striatum and SN. Quantification of mRNAs expression was made by real-time RT-PCR. Results are mean ± SD of at least three independent experiments, and are expressed as percentage of controls. Statistical signification: One-way ANOVA followed by the LSD post hoc test for multiple range comparisons; a, compared with control; b, compared LPS; c, compared with MPTP. (A) TNF-α mRNA in striatum, p < 0.001; (B) INF-β mRNA in striatum, p < 0.001; (C) IL-6 mRNA in striatum, p < 0.01; (D) IL-1β mRNA in striatum; (E) TNF-α mRNA in SN, p < 0.001; (F) INF-β mRNA in SN, p < 0.001; (G) IL-6 mRNA in SN, p < 0.001; (H) IL-1β mRNA in SN.
